This project proposal presents an Intelligent Food Supply Chain Management System for covering from field to end-user. This project is based principally on THREE (3) different application areas such as Food Plantation, Food Warehouse, and Food Transportation using a smart intelligent system. This system seeks to support and to reduce food waste by improving the reliability of the technology from manual detection to automated detection system designed especially for real-time monitoring using IoT implementation on growth and maturity level of fruits in the Food Plantation, classification of fruits grading in the Food Warehouse and also fruits controlling and tracking during Food Transportation operation. The system is implemented on a FPGA-SoC Intel Cyclone V SoC available on DE10-Nano Kit, Microsoft Azure, and Analogue Devices module to acquire the sensors reading and control the actuators to maintain the suitable environment in three different application areas. The proposed system has high-performance requirements covered by FPGA-SoC since it has concurrency and low power consumption, making it suitable for this intelligent food supply chain management system in smart agriculture applications.
Demo Video
Project Proposal
1. High-level project introduction and performance expectation
Introduction
Food supply chain management is the process of tracking numerous operations and events along the food supply chain—from the time industries acquire raw material from suppliers to the time final products reach customers' doorsteps. The process requires a variety of tasks, including monitoring, controlling, and managing the Food Plantation, Food Warehouse, and Food Transportation. The majority of food products on the market now meet consumer expectations. However, there are still incidents of consumer-related food tragedies documented. Any reported occurrence might result in costly product recalls, market withdrawals, or safety alerts for the organisations concerned.
An Intelligent Food Supply Chain Management System is key to meeting the growing consumer demand for safe products of high quality, sustainably produced, and of assured provenance. A well-managed supply chain has social, environmental, and economic benefits. The reputations of raw materials from suppliers, manufacturers, and product distributors cannot be taken lightly. Implementing an intelligent system to monitor the supply chain means risk is reduced, performance and cost-effectiveness increased, and the reputation of all involved is enhanced. Businesses that took advantage of this intelligent system increased their chances of being selected as a leading supplier by retailers and manufacturers. As a result, a new effective method is required to overcome the problem and improve the existing procedure.
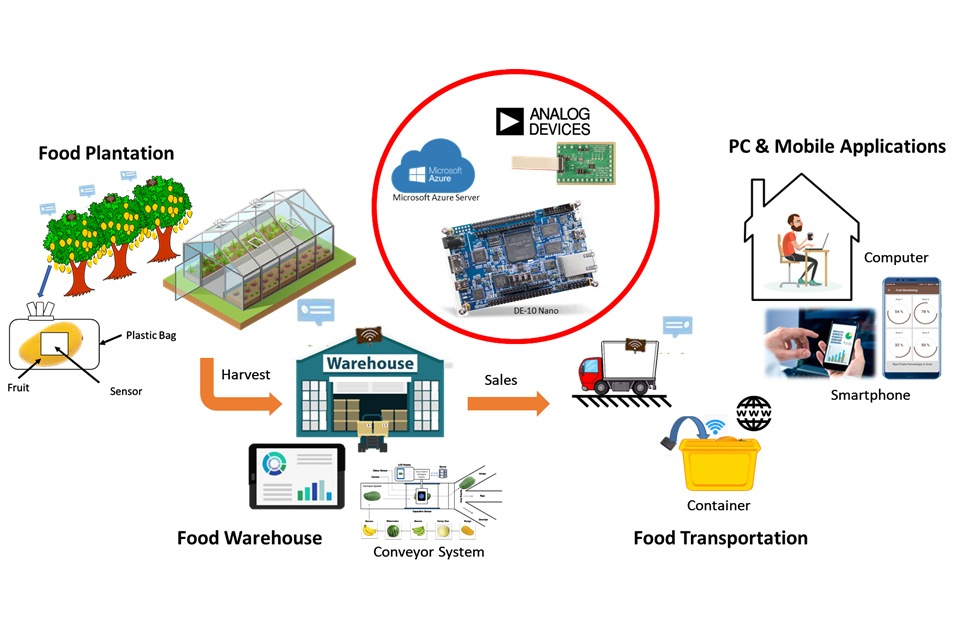
This intelligent system can be implemented by monitoring, controlling, and managing the food supply chain in THREE (3) major application areas: Food Plantation, Food Warehouse, and Food Transportation (as shown in Figure 1‑1). Numerous food-producing industries have steadily taken an interest in research into intelligent food supply chain management system. To generate a safe and high-quality food product, monitoring and controlling these three major application areas is critical. Numerous subsystems are employed in Food Plantation applications, including smart plantation management, plant species recognition, plant irrigation, pest detection, early plant disease detection, and fruit maturity monitoring. At the same time, there is just one subsystem dedicated to Food Warehouse applications, which is fruit grading using a conveyor system. Other subsystems, such as real-time transportation monitoring and container control, are devoted to Food Transportation applications area.
Finally, by integrating data from three different application areas, it is feasible to perform more precise and accurate decisions about monitoring, controlling, and managing the food supply chain compared with a single application area only. FPGA technology plays a critical role in enhancing performance by providing parallelism for data collection and analysis across three different application areas. In contrast, Microsoft Azure IoT provides a cloud-hosted back end for connecting virtually any device such as electrochemical gas detection, light detectors, temperature sensors and other modules from Analog Device. The intelligent systems covered in this project develop management systems and processes that enhance the efficiency and performance of global food supply chains.
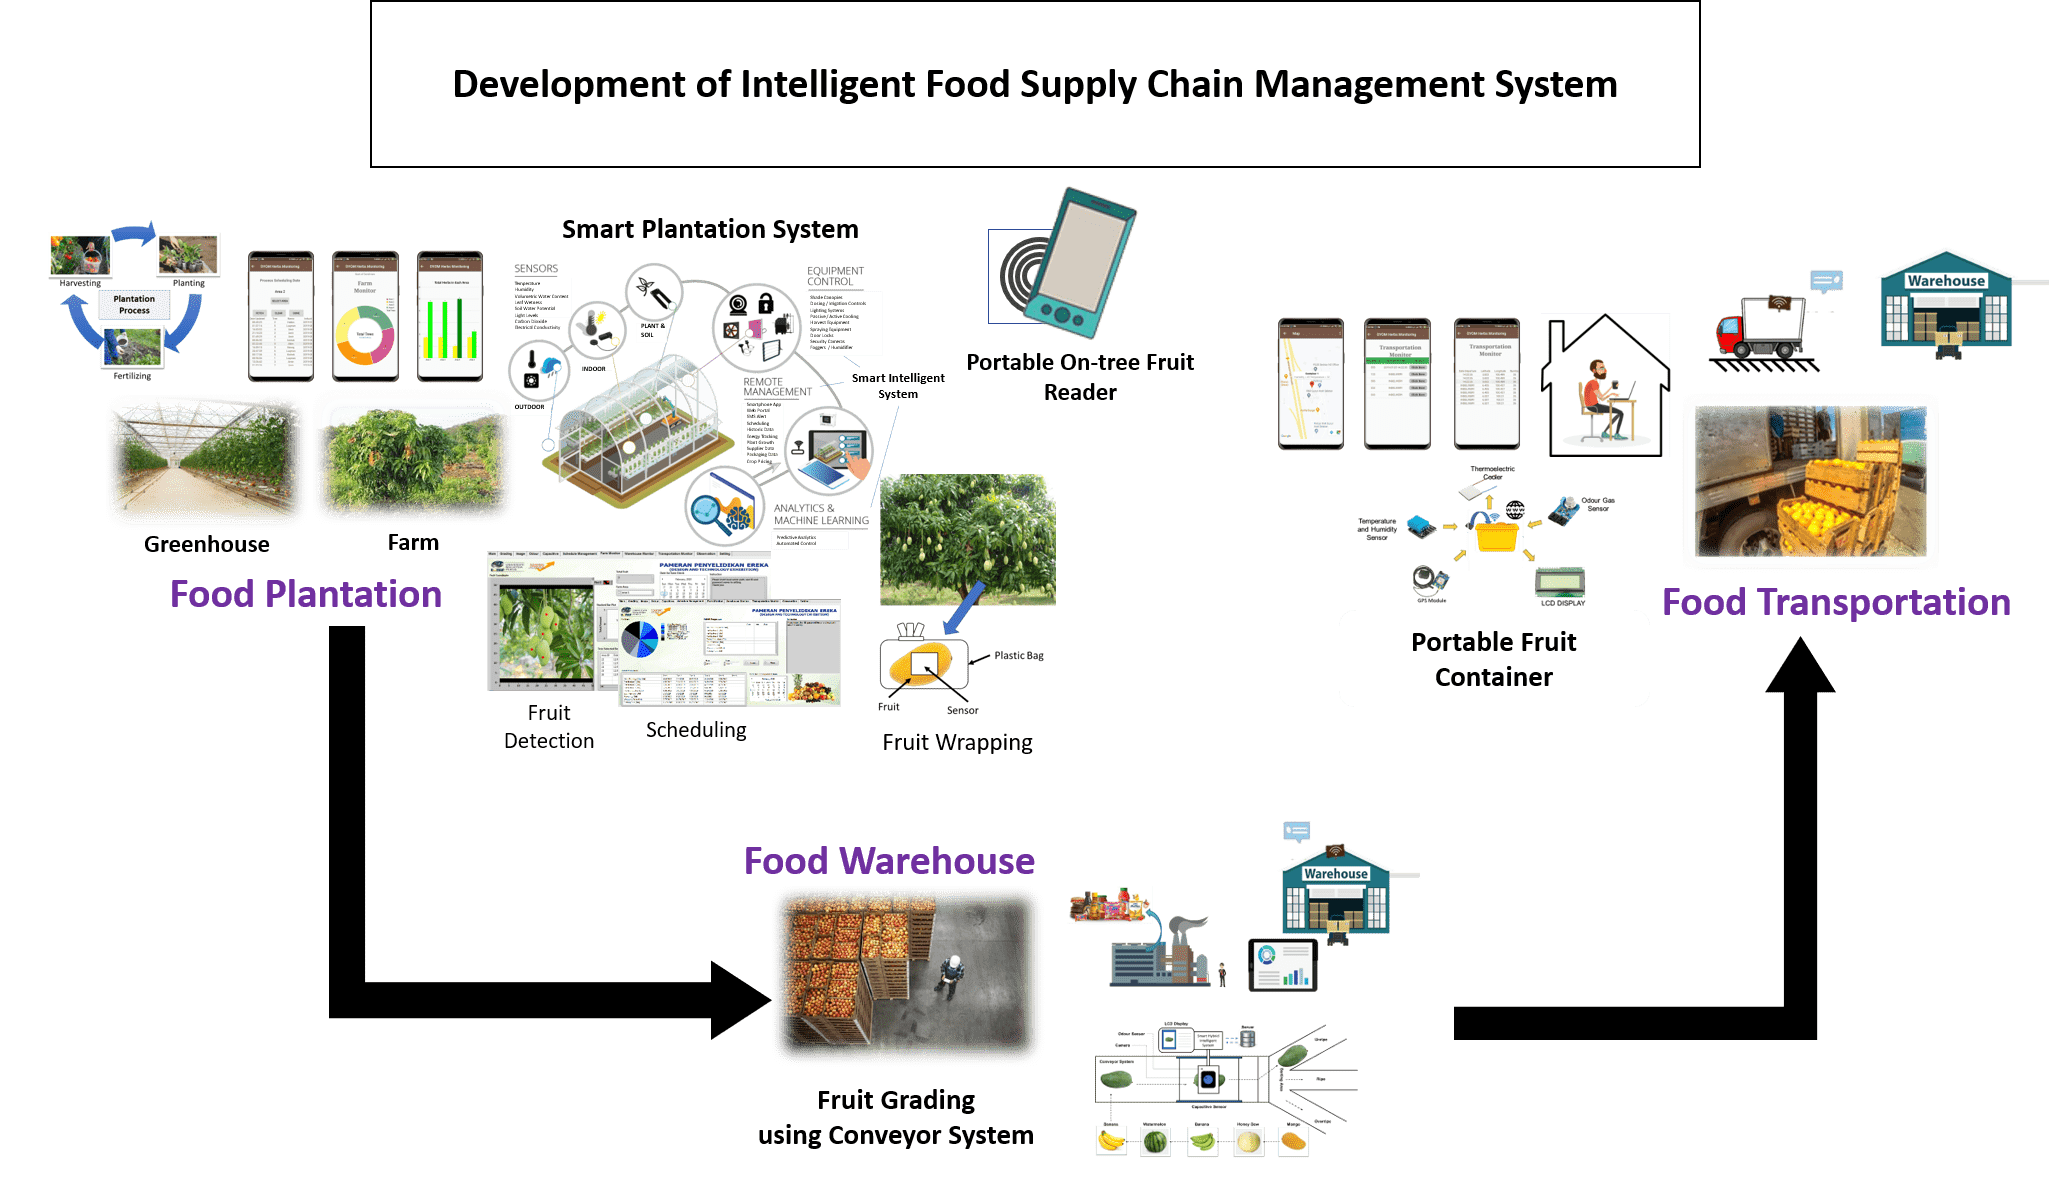
Figure 1‑1 Intelligent Food Supply Chain Management System.
Problem Statements
This project has FIVE (5) problem statements:
|
(a) |
|
Inadequate human expertise and awareness of Food Plantation, Food Warehouse, and Food Transportation system. |
|
(b) |
|
Limited digital information database collection recorded for food supply chain management system in Information Computer Technology (ICT) platform. |
|
(c) |
|
Insufficient data pattern and feature selection to reduce the enormous number of features used in the training and testing processes. |
|
(d) |
|
Improper industrial appliances for monitoring, controlling, and managing the Food Plantation, Food Warehouse, and Food Transportation system |
|
(e) |
|
Lack of food supply chain management system in Food Plantation operations, Food Warehouse operations, and Food Transportation operations. |
Objectives
This project is focused on the following objectives:
|
(a) |
|
To design and develop an Intelligent Food Supply Chain Management System utilising the expert vision, capacitive sensing, odour sensing, artificial intelligence algorithms and IoT-based technology covering the entire food supply chain from field to end-user. |
|
(b) |
|
To implement and integrate hardware with an Intelligent Food Supply Chain Management System for monitoring, controlling, and managing Food Plantation operations, Food Warehouse operations, and Food Transportation operations. |
|
(c) |
|
To verify and evaluate the performance of an Intelligent Food Supply Chain Management System in terms of monitoring, controlling, and managing the crop in the Food Plantation, grading the fruit in the Food Warehouse, and Food Transportation. |
Design Goals
The purpose of this project is to develop an Intelligent Food Supply Chain Management System using an Artificial Neural Network implemented on an Intel Cyclone V SoC device (DE-10 Nano Kit), Microsoft Azure IoT as a cloud-hosted solution back end for connecting virtually any device, and Analog Device as peripheral devices for collecting data from multiple sensors. The system consists of THREE (3) main application areas: Food Plantation, Food Warehouse, and Food Transportation.
There are SIX (6) subsystems in the Food Plantation application area such as smart plantation management, plant species recognition, plant irrigation, pest detection, early plant disease detection, and fruit maturity monitoring. The plant species recognition system, pest detection system and early plant disease detection system are mostly image-processing-based, utilising a camera to acquire images with a resolution of 1080 pixels. Meanwhile, smart plantation management system, plant irrigation system, and fruit maturity monitoring system are focus on sensors and modules from Analog Devices to collect, control, and store the data.
In Food Warehouse applications, a fruit grading system is implemented after the harvesting process at the plantation. The fruit grading system uses THREE (3) approaches which are image, odour, and capacitive processing. This system is the most critical project component because it is responsible for grading the fruits harvested from the plantation to deliver them to the consumers.
The last application is Food Transportation which are divided into TWO (2) subsystems: (i) real-time transportation monitoring and (ii) container control systems. The real-time transportation monitoring system deals with container location and data transfer, whereas the container control system is focused on container environment parameters such as gas concentration, temperature, and relative humidity.
Once the process is complete and data stored in the cloud, the user can monitor real-time data from sensors and cameras on their smartphones or computers as long as they are connected to the internet. Thus, the proposed system can do an intelligent food supply chain management system.
Application areas and Target users
This system is structured toward agricultural-based industries, specifically toward farmers and food producers. The system aims to minimise food waste by enhancing the efficiency of the food supply chain management system in THREE (3) applications areas: Food Plantation, Food Warehouse, and Food Transportation. The proposed system decreases their reliance on expertise and enables them to minimise the food waste throughout harvesting on the Food Plantation area, storing in the Food Warehouse, and Food Transportation via container. Additionally, this system utilises FPGA-SoC devices, Internet of Things (IoT) technology, and artificial intelligence to address global food waste issues and improve the efficiency and performance of global food supply chains. Thus, the proposed system is oriented to high performance embedded system designers and human-computer interaction researchers.
2. Block Diagram
As mentioned before, this proposed system is applied for THREE applications areas, which are Food Plantation, Food Warehouse and also Food Transportation.
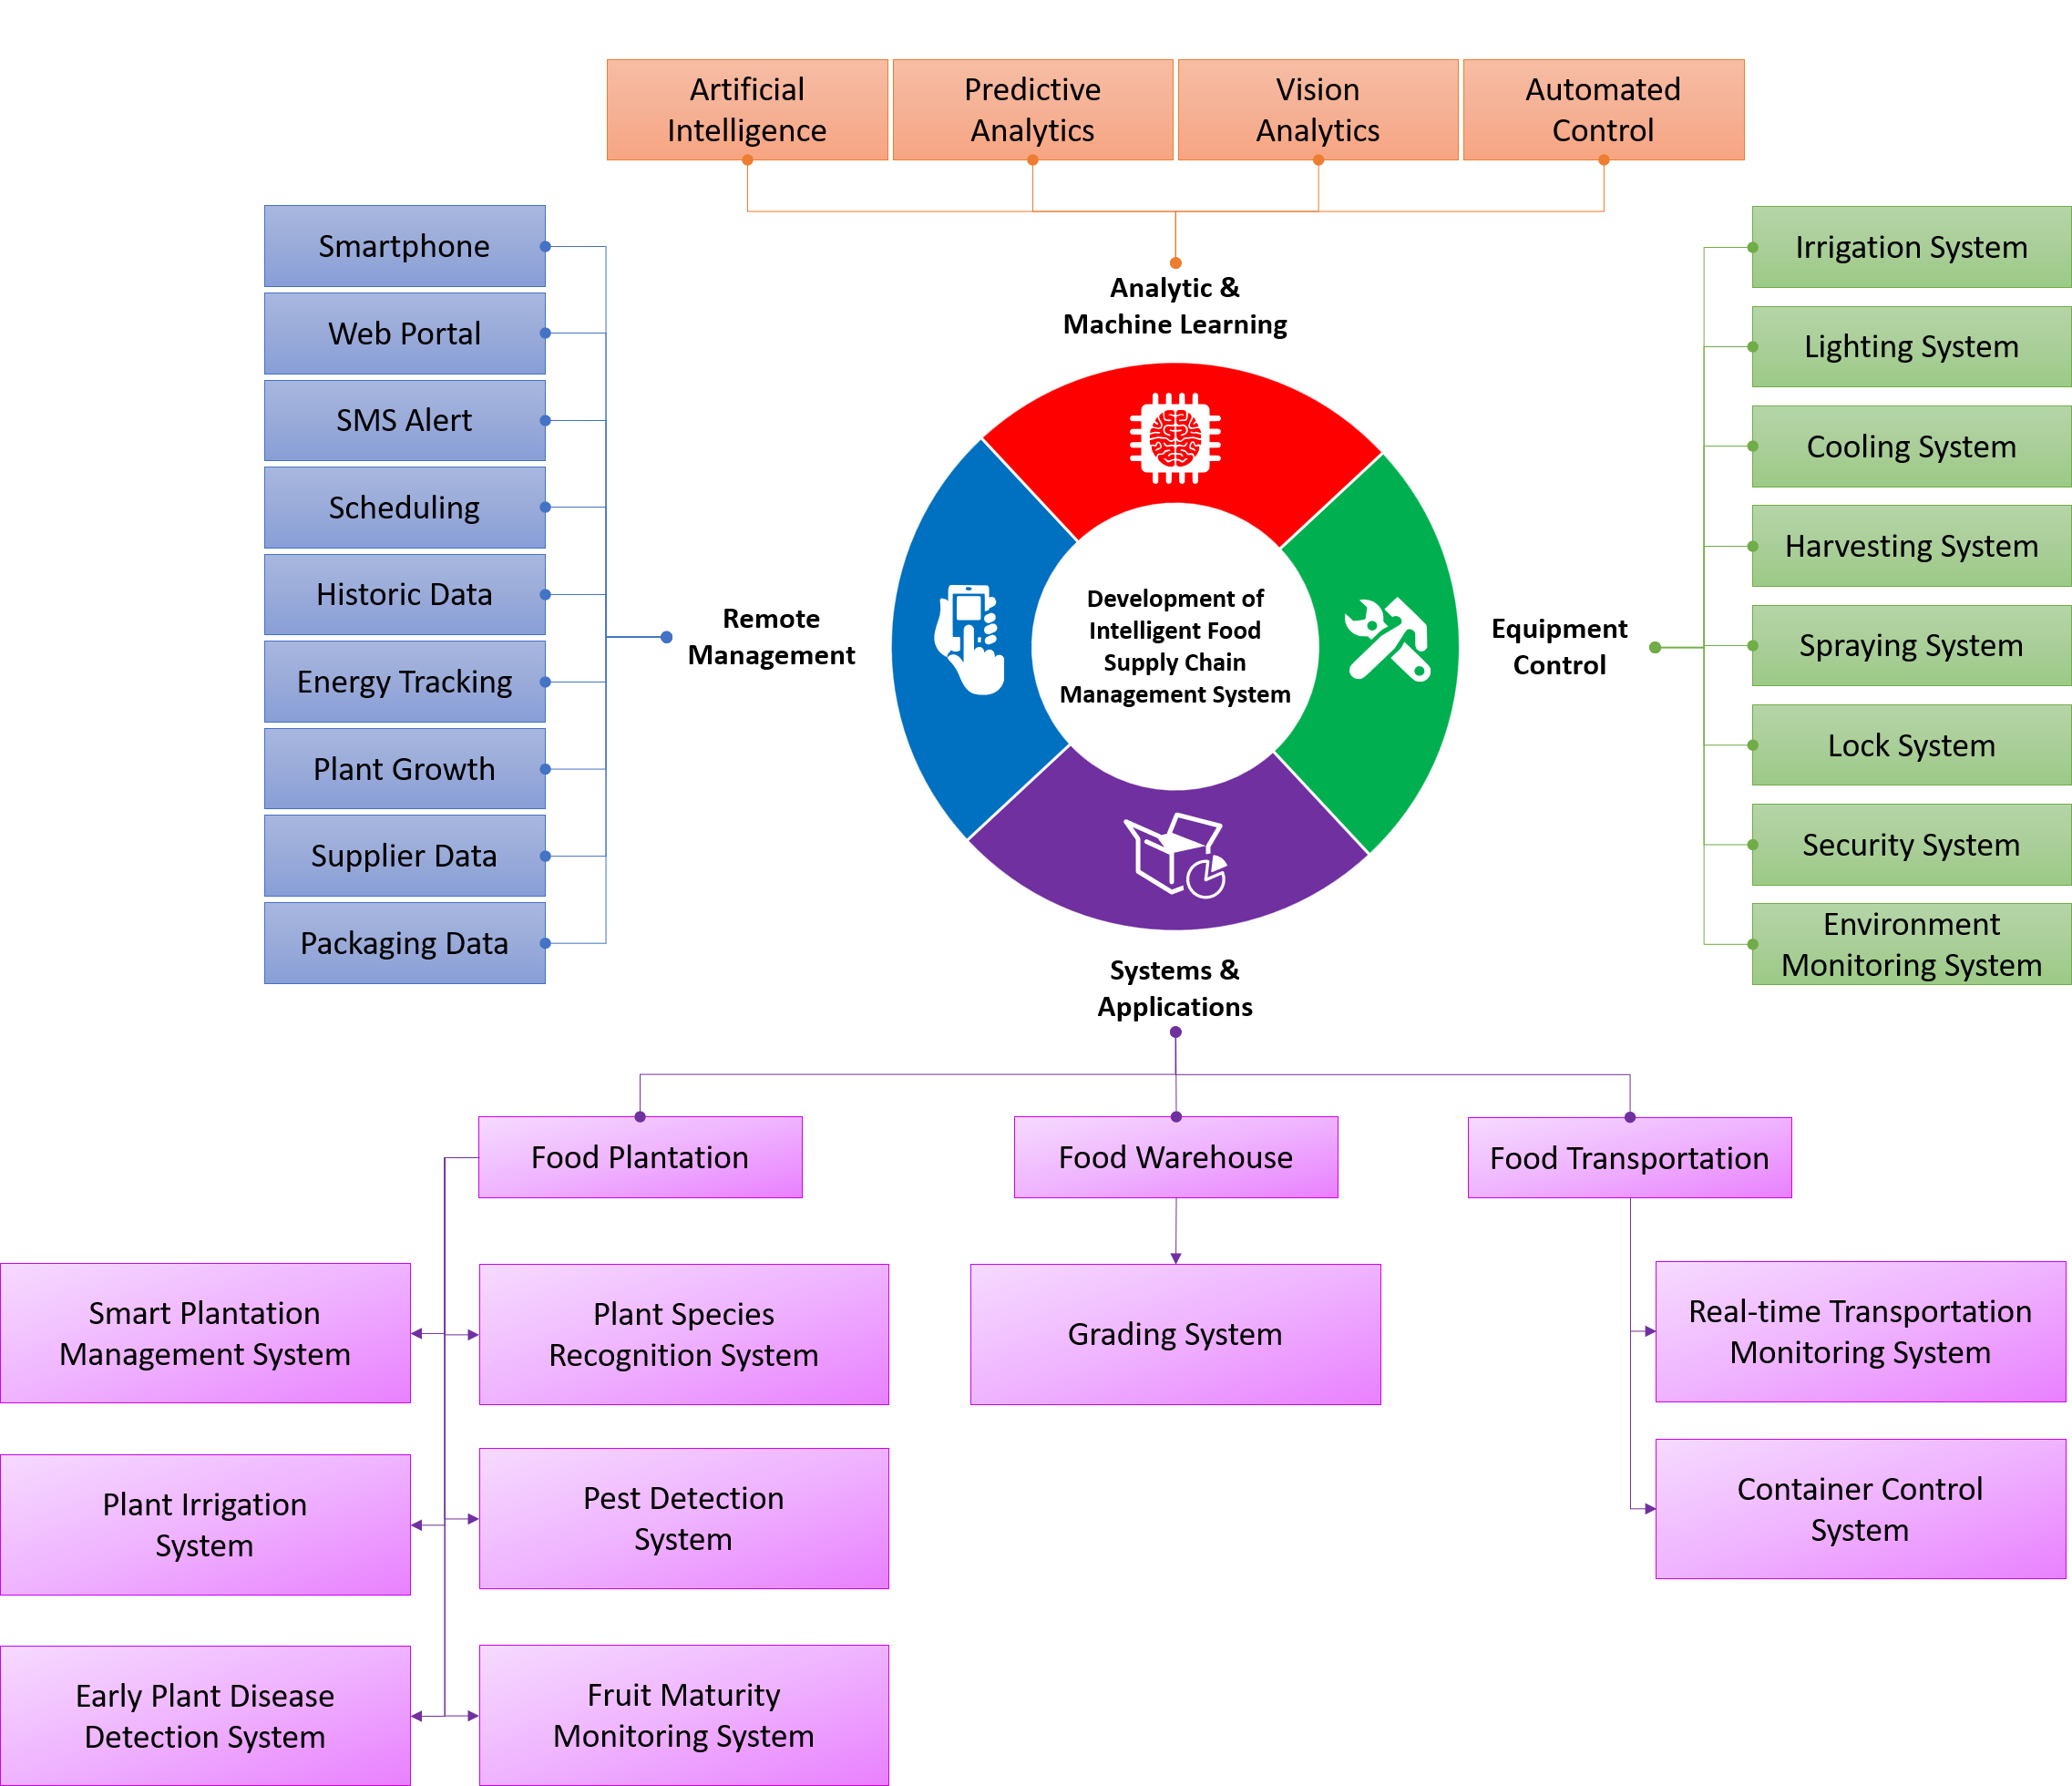
Figure 2‑1 Overall bock diagram system implemented in proposed project.
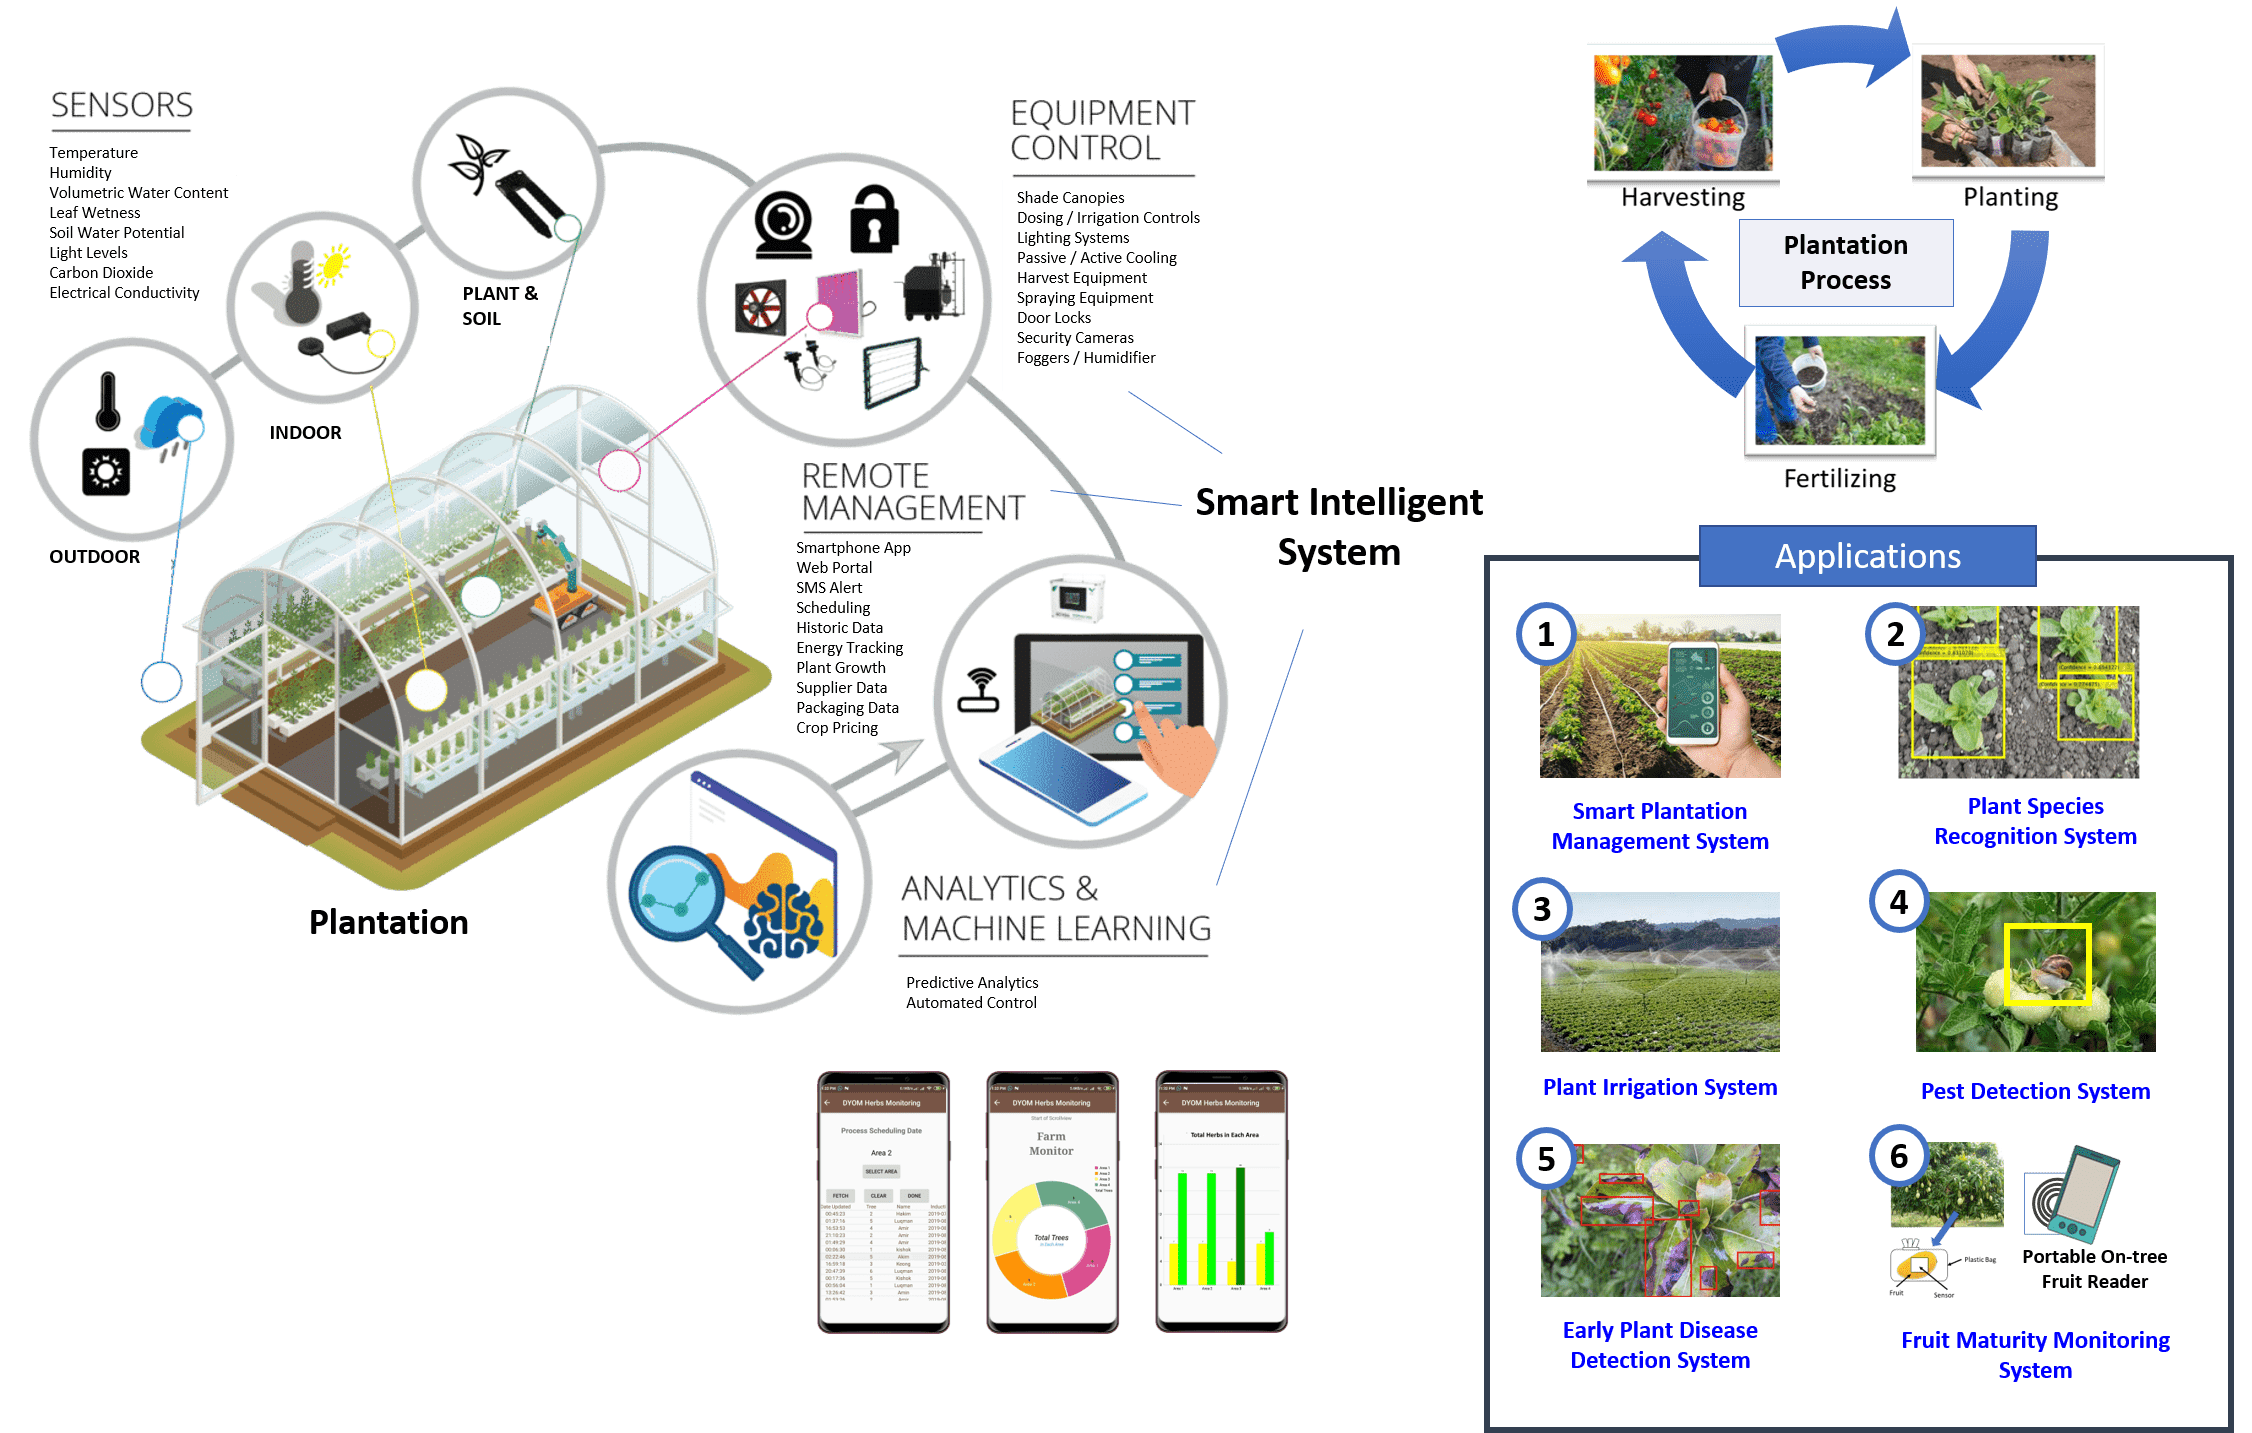
Figure 2‑2 Overall food plantation application implemented in proposed project.
In food plantation applications as shown in Figure 2‑1 and Figure 2‑2, there are comprises of several systems, which are:
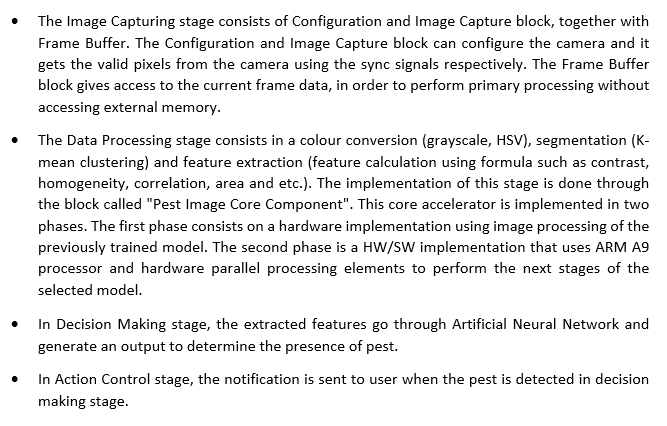
1. Pest Detection
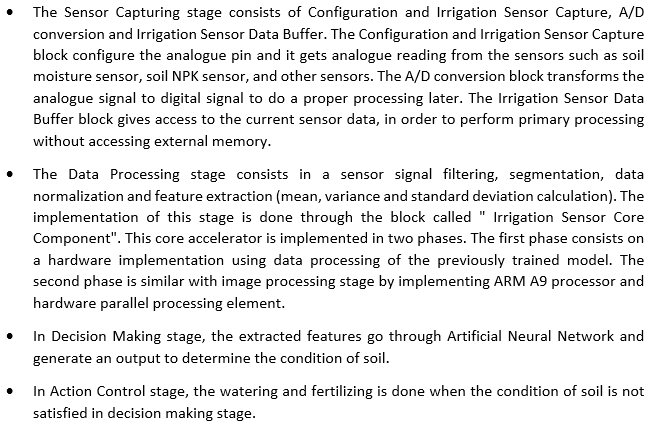
2. Plant Irrigation (Watering and Fertilizing)
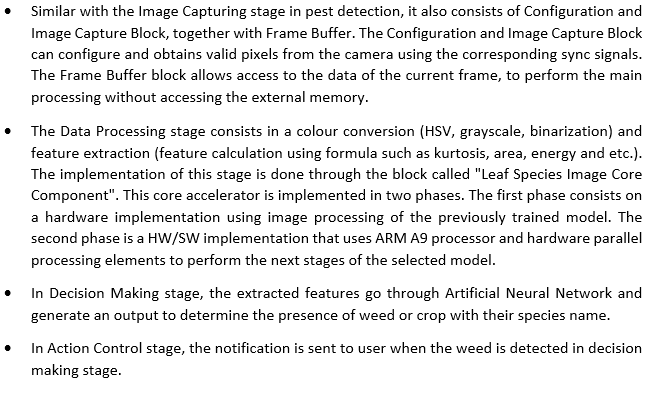
3. Plant Species Recognition
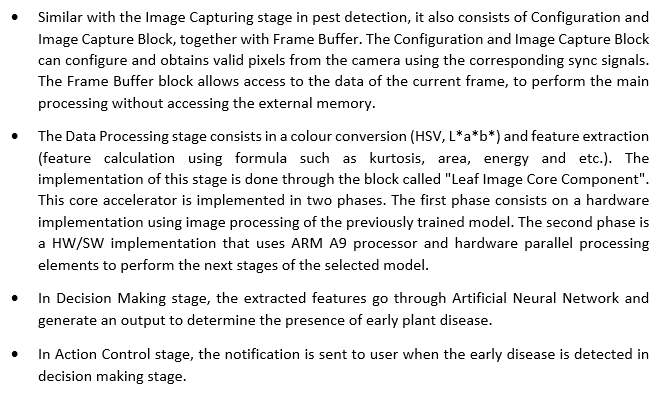
4. Early Plant Disease Detection
5. Smart Plantation Management
6. Fruit Maturity Monitoring
Detection of pests in the crop fields is a major challenge in the field of agriculture, therefore effective measures should be developed to fight the infestation while minimizing the use of pesticides. The techniques of image analysis are extensively applied to agricultural science, and it provides maximum protection to crops, which can ultimately lead to better crop management and production. In pest detection system, it went through the four main stages such as Image Capturing, Data Processing, Decision Making and Action Control.
Irrigation is an artificial way of watering and fertilizing the soil for the proper growth of the plant. Due to this water logging will occur while using manual irrigation to water and fertilize the crops, so there is a need for the improvement on these existing techniques in order to conserve water and provide the suitable amount of water and fertilizer. The plant irrigation went through the four main stages: Sensor Capturing, Data Processing, Decision Making and Action Control.
Plant identification is not exclusively the job of botanists and plant ecologists. It is required or useful for large parts of society, from professionals (such as landscape architects, foresters, farmers, conservationists, and biologists) to the general public (like ecotourists, hikers, and nature lovers). But the identification of plants by conventional means is difficult, time consuming, and (due to the use of specific botanical terms) frustrating for novices. This creates a hard-to-overcome hurdle for novices interested in acquiring species knowledge. In recent years, computer science research, especially image processing and pattern recognition techniques, have been introduced into plant taxonomy to eventually make up for the deficiency in people's identification abilities. This plant species recognition is focused on the leaf’s shape, texture and other characteristics, using image processing technique. The plant species recognition went through the four main stages: Image Capturing, Data Processing, Decision Making and Action Control.
Producing fruit is a daunting task as the plant is exposed to the attacks from various micro-organisms and bacterial diseases and pests. The symptoms of the attacks are usually distinguished through the leaves, stems or fruit inspection. This early plant disease detection is focused on the leaf’s inspection using image processing technique. The early plant disease detection went through the four main stages: Image Capturing, Data Processing, Decision Making and Action Control.
Currently, plantations such as greenhouses and farms have grown in popularity. Many high-value crops, ranging from ornamental flowers to tomatoes, are produced commercially in planation for just that reason. Plantation production also allows for multiple crop cycles per year, similar to indoor production.
But, like in any controlled environment, potential problem areas exist in plantation that must be monitored and proactively addressed. Losing control of your environment can lead to cultivation headaches ranging from poor airflow to extreme temperatures, as well as opportunities for diseases, such as waterborne viruses like Pythium.
Therefore, this smart plantation management system has elements that monitor and control temperature, humidity, electrical conductivity, pH, carbon dioxide (C02), fogging, and read external weather conditions via a weather station. This plantation control went through the four main stages: Sensor Capturing, Data Processing, Decision Making and Action Control.
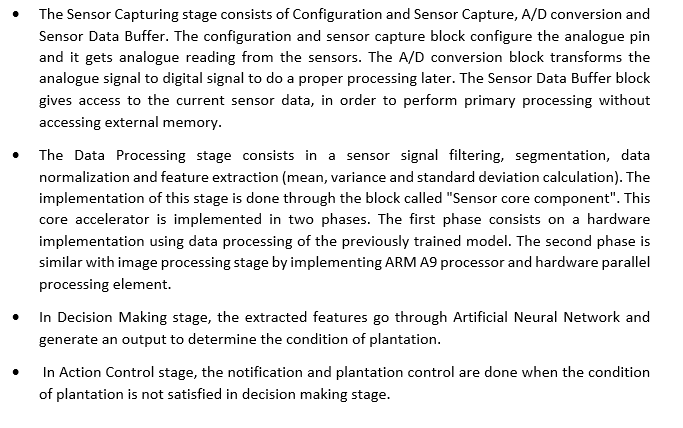
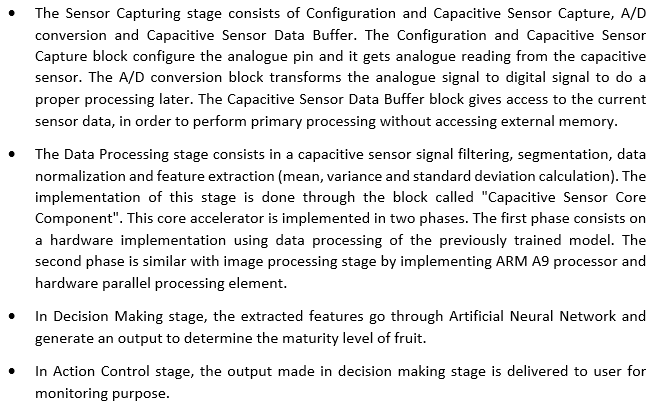
Fruit maturity at harvest greatly affects the postharvest quality of all fruits along the postharvest value chain. Accurate, efficient, and effective maturity indices must be used in order to supply high-quality fruits for consumers and processors. A single maturity index cannot be used to predominantly determine the maturity of fruits. In this proposed project, the fruit maturity monitoring is implemented using capacitive sensor, which can be mounted on the on-tree fruits to read the dielectric response in real-time. This fruit maturity monitoring went through the four main stages: Sensor Capturing, Data Processing, Decision Making and Action Control.
The high-level block diagram and flow diagram shown in Figure 2‑3 and Figure 2‑4 describe the principal elements that are part of the proposed system in food plantation application. Table 2‑1 also describe the component used and its function in food plantation application.
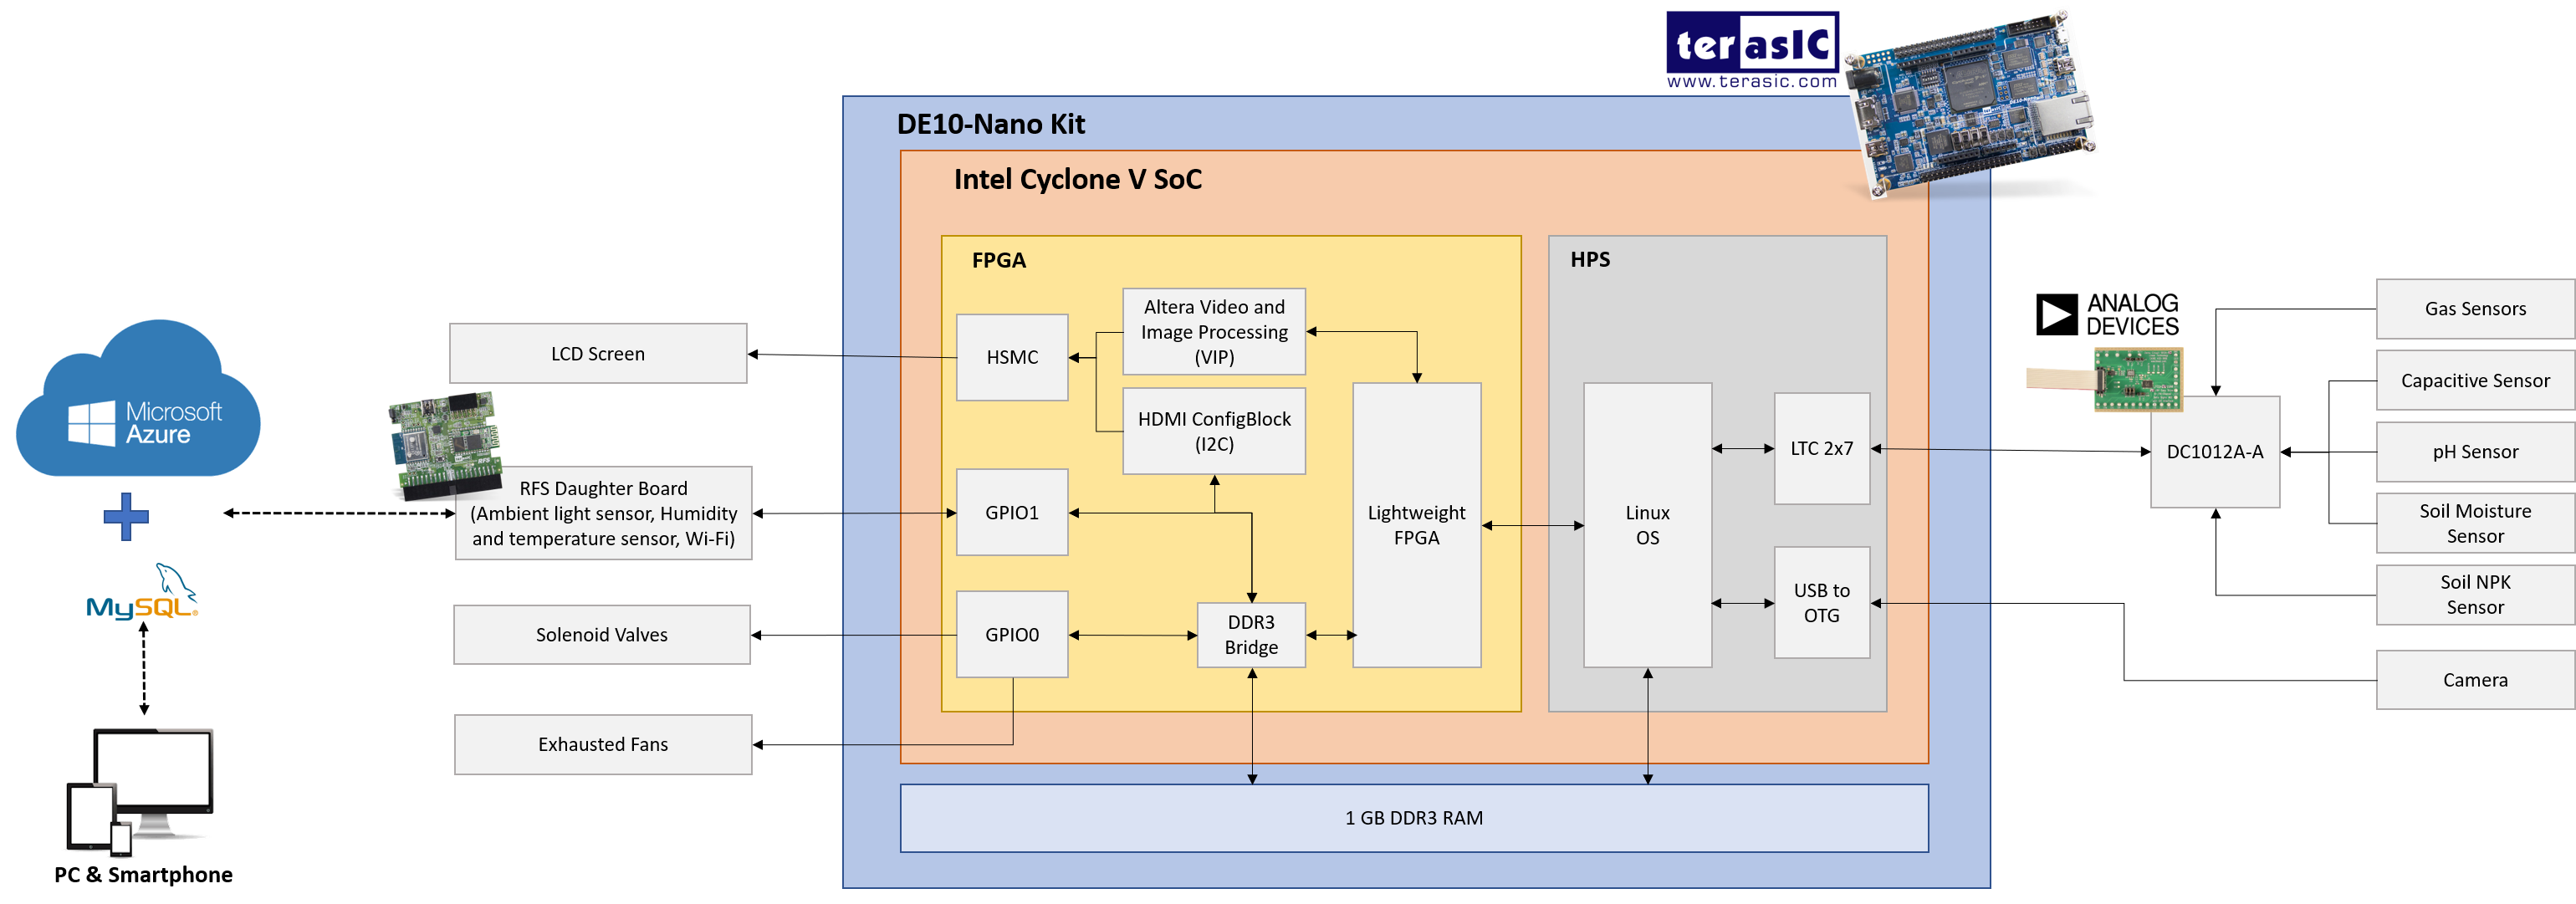
Figure 2‑3 Block diagram for proposed system architecture in food plantation application.
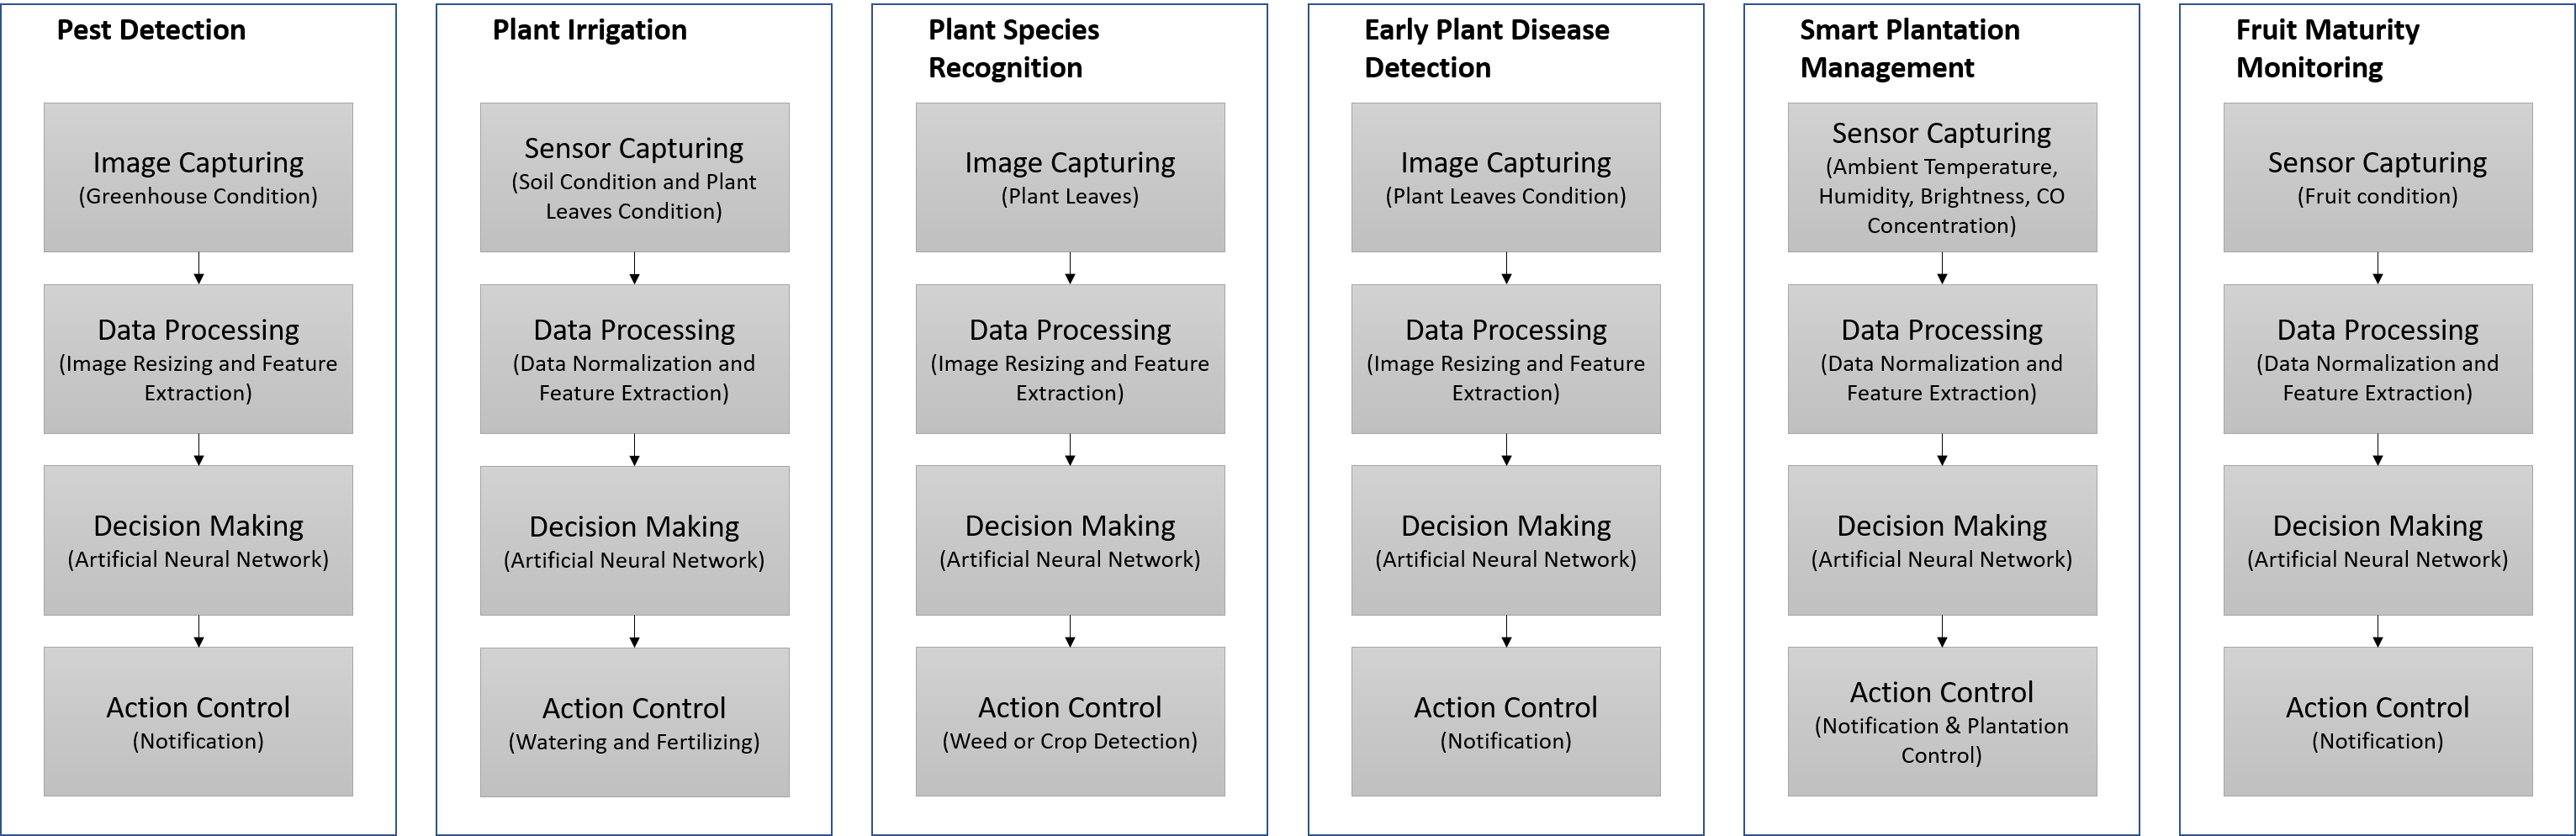
Figure 2‑4 Application process in the proposed system in food plantation application.
Table 2‑1 Components and its function in food plantation application.
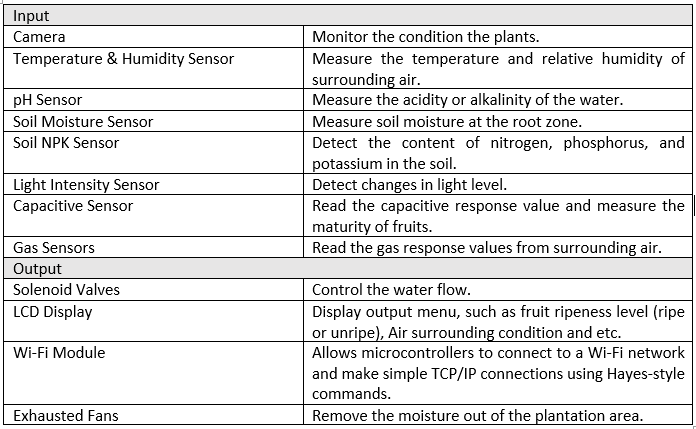
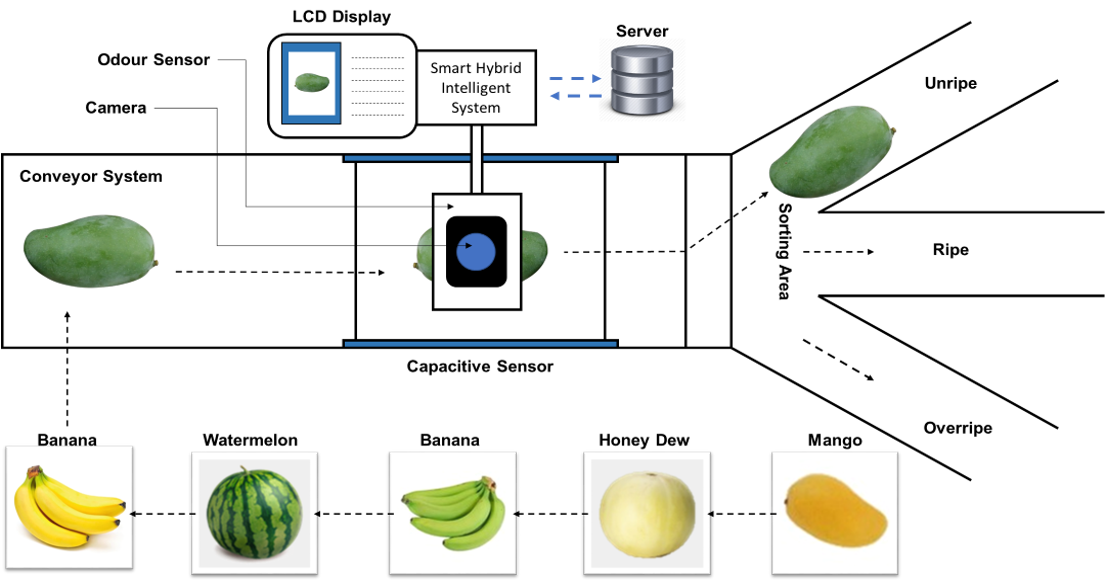
Figure 2‑5 Food warehouse application process in the proposed system.
In food warehouse application (as Figure 2‑1 and Figure 2‑5), there is implementing fruit grading system after the harvesting from plantation. Grading of fruits is a very important operation as it fetches high price to the grower and improves packaging, handling and brings an overall improvement in marketing system. The fruits are generally graded on basis of size and graded fruits are more welcome in export market. Grading could reduce handling losses during transportation. In this proposed project, the fruit grading system is focused on THREE methods: image, odour and capacitive processing, based on the fruit grade such as size, colour, texture, bruise and other characteristics. This system went through the four main stages: Data Capturing, Data Processing, Decision Making and Action Control.

The high-level block diagram and flow diagram shown in Figure 2‑6 and Figure 2‑7 describe the principal elements that are part of the proposed system in food warehouse application. Table 2‑2 also describe the component used and its function in food warehouse application.
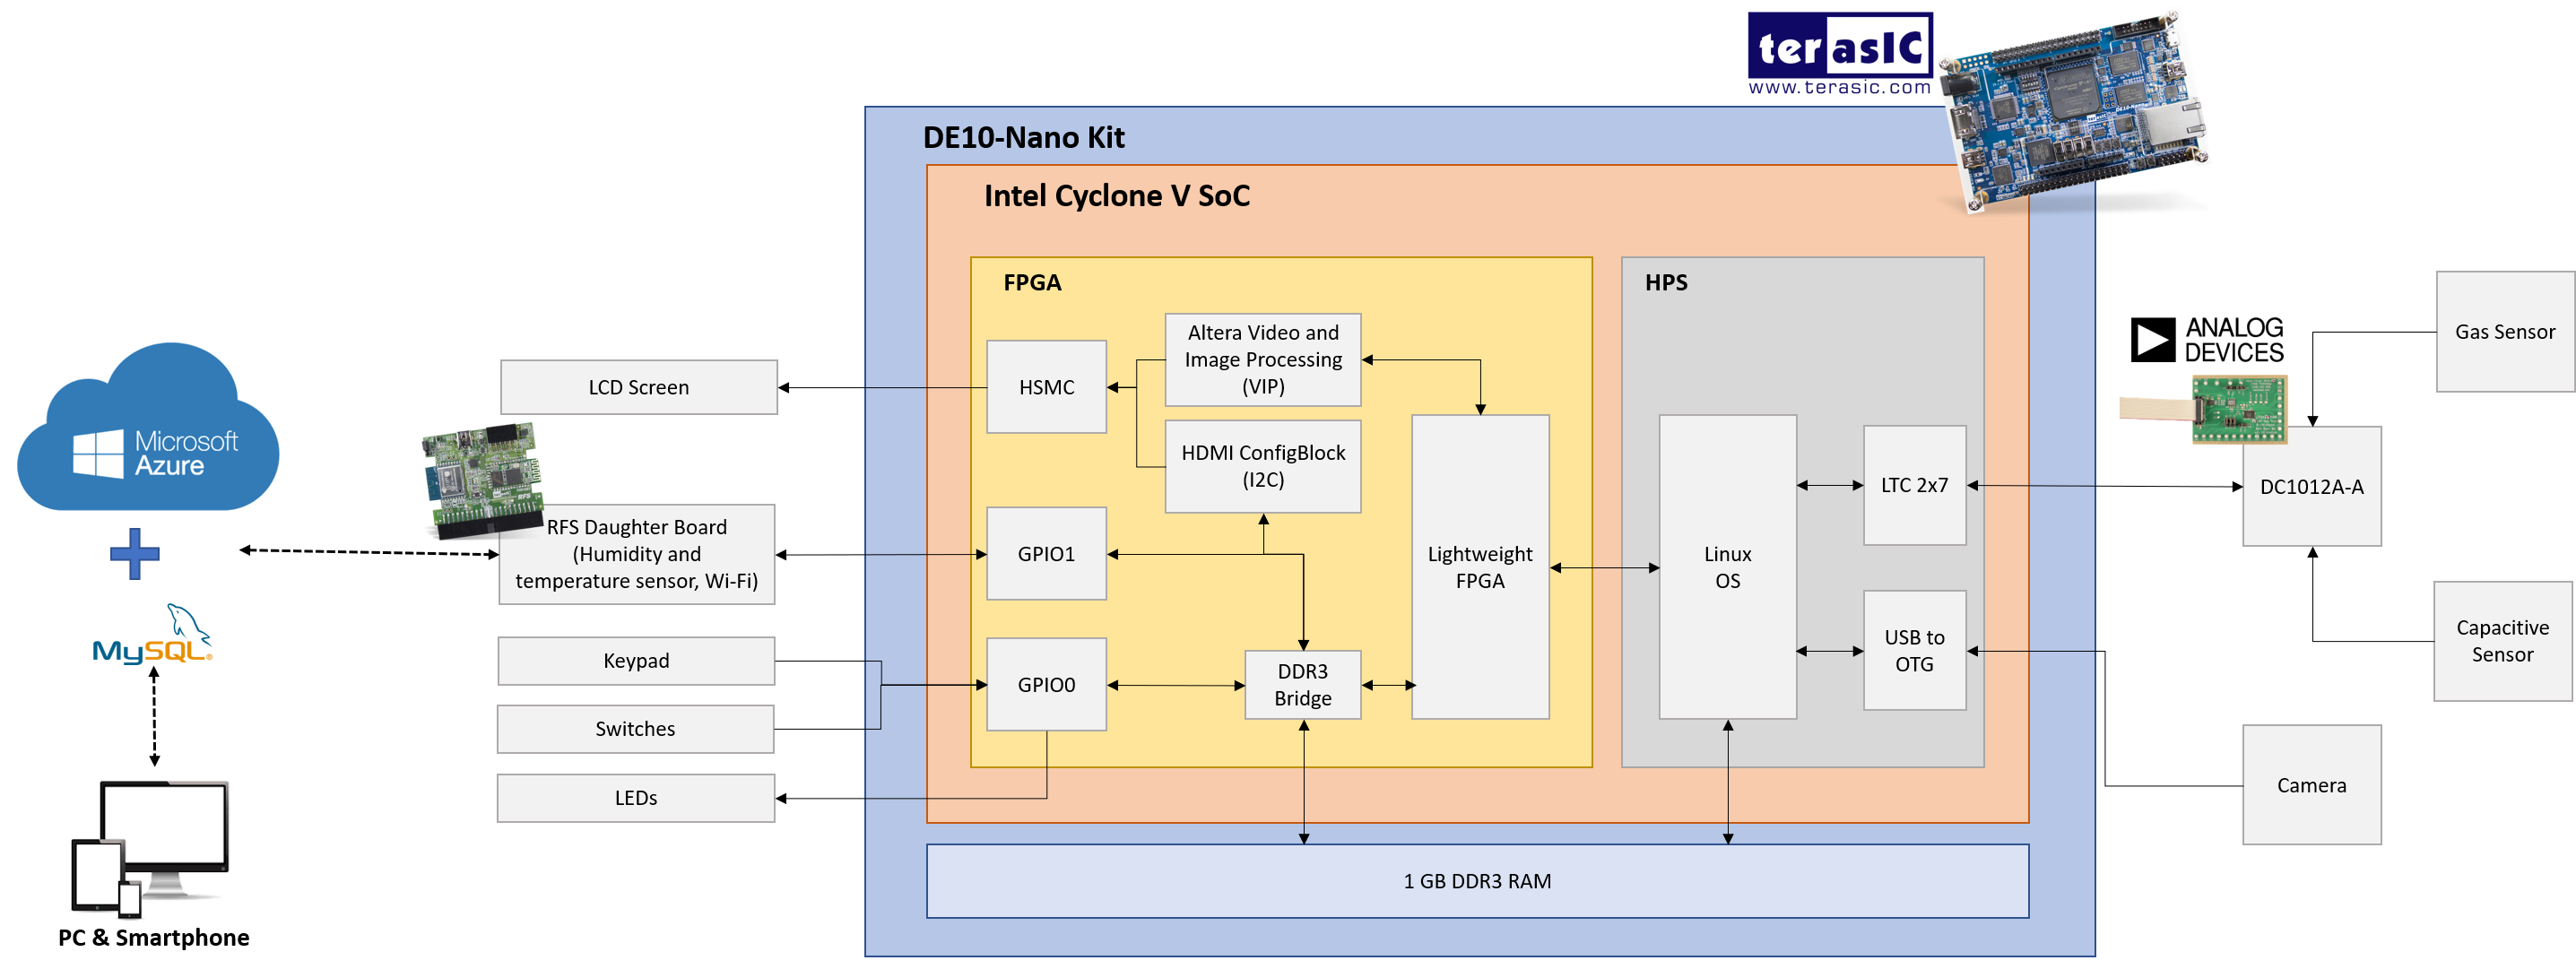
Figure 2‑6 Block diagram for proposed system architecture in food warehouse application.
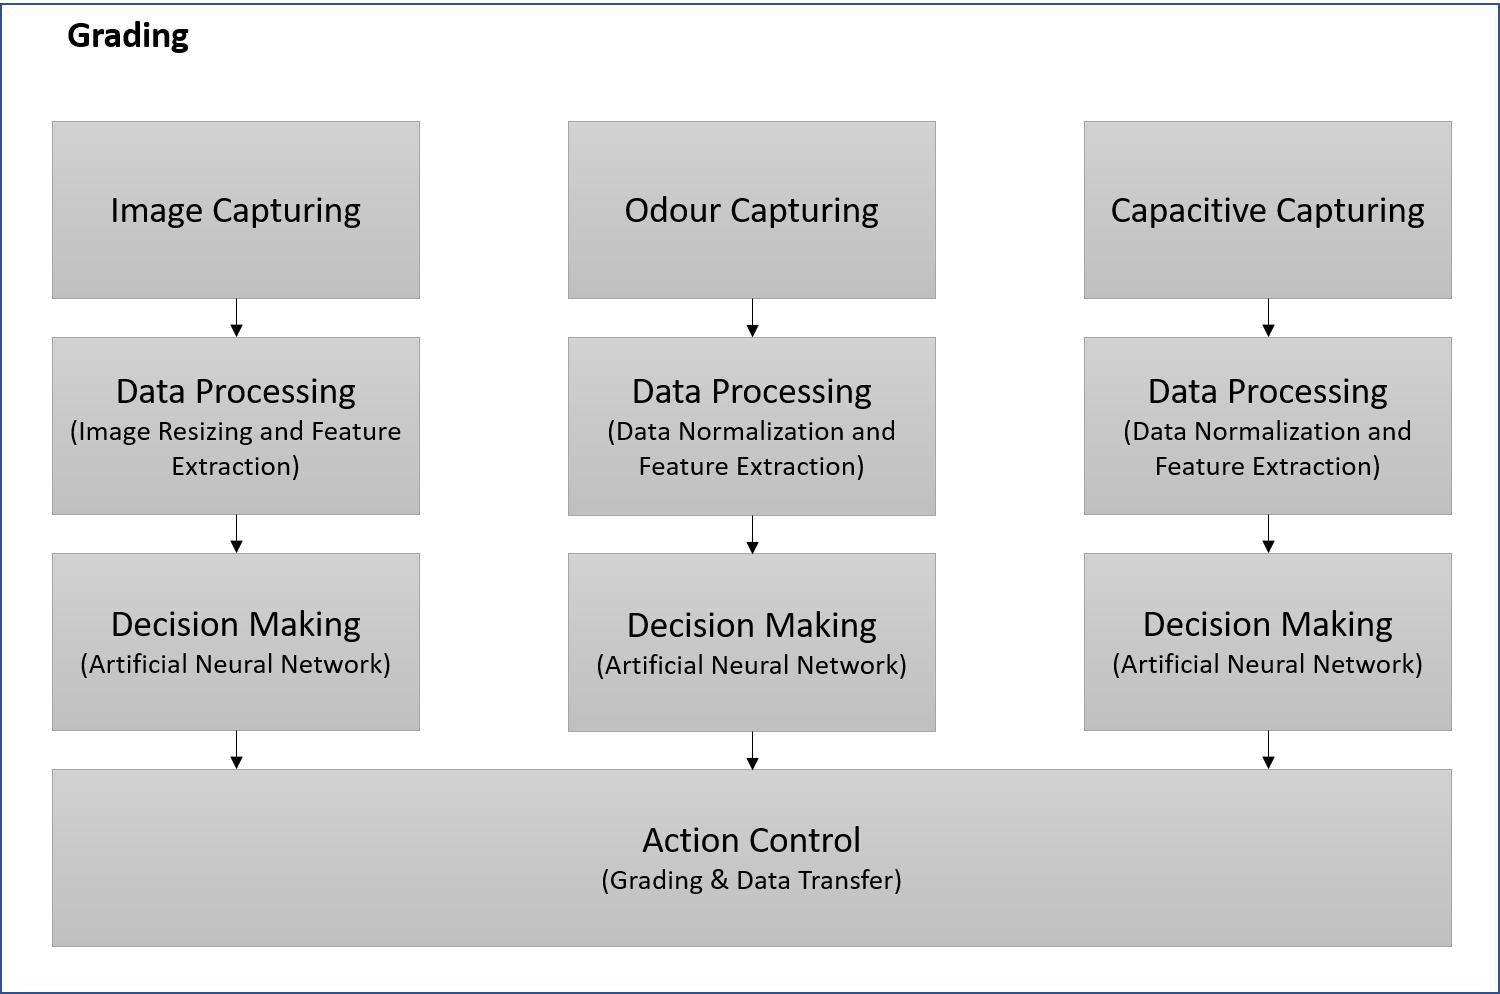
Figure 2‑7 Application process in the proposed system in food warehouse application.
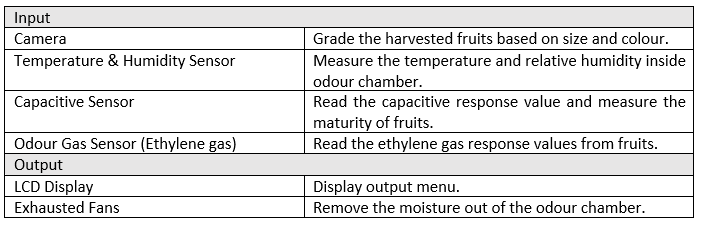
Table 2‑2 Components and its function in food warehouse application.
![]()
Figure 2‑8 Food transportation application process in the proposed system.
Moreover, the control of the main environmental factors that influence the quality of perishable products is one of the main challenges of the food industry. Temperature is the main factor affecting quality, but other factors like relative humidity and gas concentrations (mainly C2H4, O2 and CO2) also play an important role in maintaining the postharvest quality of horticultural products. For this reason, monitoring such environmental factors is a key procedure to assure quality throughout shelf life and evaluate losses. Therefore, in order to estimate the quality losses that a perishable product can suffer during storage and transportation, a real-time monitoring system has been developed. In food transportation application as illustrated in Figure 2‑1 and Figure 2‑8, there are implementing container control and real-time transportation monitoring.
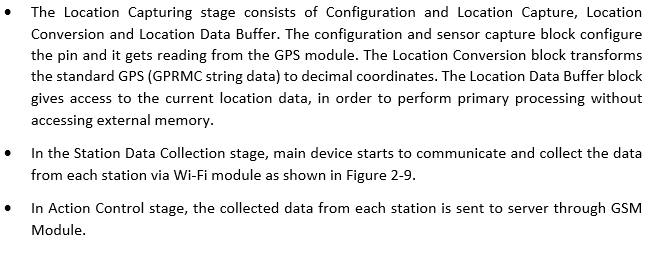
The container control system is focused on the container environment monitoring, such as ammonia gas concentration, oxygen gas concentration, carbon dioxide gas concentration, temperature, relative humidity and other environment parameters. This system went through the four main stages: Sensor Capturing, Data Processing, Decision Making and Action Control.
Besides, the real-time transportation monitoring system is focused on the location of container and container data transfer. This system went through the four main stages: Location Capturing, Node Data Collection, and Action Control.
The high-level block diagram and flow diagram shown in Figure 2‑10 and Figure 2‑11 describe the principal elements that are part of the proposed system in food transportation application. Table 2‑3 also describe the component used and its function in food transportation application.
![]()
Figure 2‑9 Communication between station and main device in food transportation application.
![]()
Figure 2‑10 Block diagram for proposed system architecture in food transportation application.
![]()
Figure 2‑11 Application process in the proposed system in food transportation application.
Table 2‑3 Components and its function in food transportation application.
![]()
3. Expected sustainability results, projected resource savings
Sustainability is commonly described as addressing current needs without affecting future generations' ability to meet their needs. It is founded on THREE (3) fundamental pillars: economic, environmental, and social.
Environmental pillars frequently receive the most significant emphasis. Organisations are concentrating on minimising their water consumption, packaging waste, carbon footprints, and overall environmental impact. Organisations have discovered that having a positive environmental impact can also have a significant financial benefit. Typically, reducing the amount of material used in operation results in a reduction in the overall cost of those materials. For instance, a plant irrigation system in a food plantation application area uses an automatic system to water and fertilise the soil to ensure the plant's healthy growth according to plant's need, promoting less water and fertiliser usage while providing the optimum amount of water and fertiliser for the plants.
In terms of the social pillar, a sustainable system should have the support and acceptance of its employees, stakeholders, and the community in which it operates. While there are numerous strategies for securing and sustaining this support, it all comes down to treating employees and community members fairly, both locally and globally. For instance, with the growth of automation and IoT technologies, staff no longer need to physically visit the plantation regularly to monitor and control the plants, as they can do it remotely via their smartphone or computer as long as they are connected to the internet.
Finally, the pillars of economic sustainability are the sectors where most people believe their system is on track. A system must be profitable in order to be sustained. At the same time, profitability cannot overcome the other two pillars. Indeed, profit maximisation at any cost is not the economic pillar. Compliance, good governance, and risk management are all examples of activities that align with the economic pillars. For example, the container control system used in a food transportation application can monitor and control fruits parameters during transportation, thereby ensuring the maximum possible fruits quality. As a result, rotten or damaged fruits during transportation can be minimised, reducing the loss and wastage of damaged fruit, which indirectly increases profits.
4. Design Introduction
Intel FPGA Virtues in Your Project
-
- Boosts Performance: Our project would consist of a low performance single board computer. A hybrid intelligence algorithm's inference is a difficult task that can be parallelized to improve performance. As a result, we implement this component on the FPGA. Furthermore, offloading this job from the CPU frees up the CPU's resources to focus solely on maintaining the GUI and screen output.
The FPGA's highly parallel computing architecture enables for real-time interaction with the user while requiring less power. Many tasks, such as matrix operations and data collecting, can be done in a few clock cycles due to extensive hardware resources and high processing capabilities. In comparison, even if traditional processing platforms such as CPUs and GPUs have faster clock speeds, doing the above-mentioned activity requires a big number of clock cycles and consumes a lot of power, making the FPGA the best contender for high-performance mobile computing.
- Boosts Performance: Our project would consist of a low performance single board computer. A hybrid intelligence algorithm's inference is a difficult task that can be parallelized to improve performance. As a result, we implement this component on the FPGA. Furthermore, offloading this job from the CPU frees up the CPU's resources to focus solely on maintaining the GUI and screen output.
-
- Expands I/O: The system's inbuilt ADC, USB to OTG, LCD monitor interface, and GPIOs provide a very adaptable user interface that makes system operation incredibly simple.
-
- Adapts to changes: Every time the device is powered up, the FPGA functionality can vary. So, if the user wishes to make a change, he or she may simply download a new configuration file to the device and experiment with it. Frequently, updates to the FPGA can be made without the need for costly PC board replacements. Many devices have fixed hardware functionality that cannot be modified without incurring a significant cost and time investment. Therefore, FPGA outperform other devices in adaptability to changes.
5. Functional description and implementation
This project currently has THREE (3) primary functions:
- Image methods process data using image processing techniques;
- Sensor methods process data using signal data from sensors.
- To store and share data, the third technique uses a cloud server and IoT technologies.
Image Method
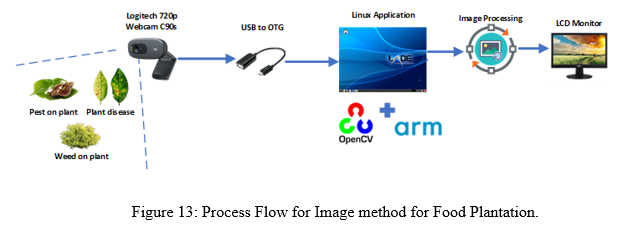
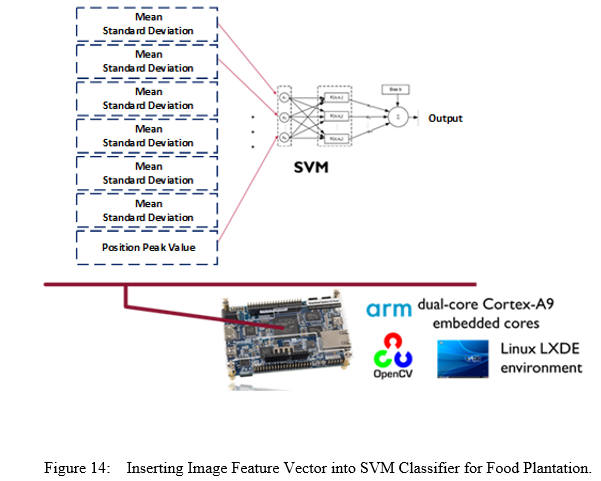
This method focuses on image analysis from plantation images for Food Plantation. As illustrated in Figure 13, the tools and equipment used for this procedure are a USB Webcam, OpenCV in DE10 Nano Linux LDXE, monitor, mouse, and keyboard. DE10 Nano reads the image from the webcam and saves it to a folder. The image is then converted into four other formats: RGB, HSV, L*a*b* colour space, Grayscale, and Binary. Before beginning the K-mean clustering process, all of the processed images are saved as picture files. Furthermore, the collected image is extracted to determine the mean of R (red), G (green), B (blue), H (hue), S (saturation), V (value), and area. These extracted data are transformed into feature vectors, which are then used to train and test models using the Support Vector Machine (SVM) algorithm (as shown in Figure 14). As a result, the output will display on the LCD monitor screen about the information and status of environment monitoring such as detection of pest, weeds, and early plant disease.
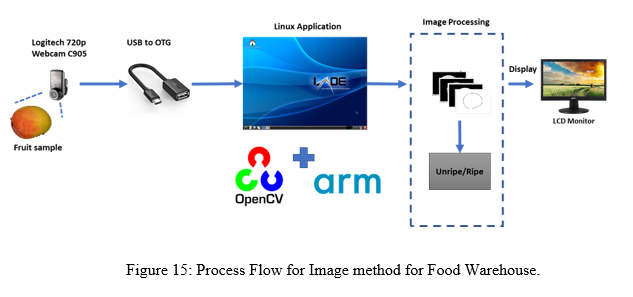
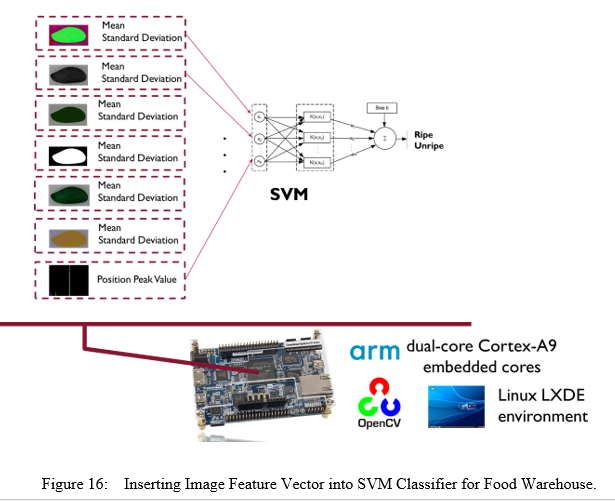
For Food Warehouse, this method is focus on the colour analysis from fruit image. The tools and equipment used for this method are USB Webcam, OpenCV in DE10 Nano Linux LDXE, monitor, mouse and keyboard as shown in Figure 15. DE10 Nano read image from webcam and save the image captured in a folder. Then, the image is processed into four different processes, which are converting RGB image into HSV, L*a*b* colour space, Grayscale and Binary image. All the processed image is saved as image file before start K-mean clustering process. In addition, the captured image is extracted to calculate the mean of R (red), G (green), B (blue), H (hue), S (saturation), V (value) and area of the capture image. These extracted data are converted into feature vector and then insert into Support Vector Machine (SVM) algorithm for training and model testing (as shown in Figure 16). So, the output will display on the LCD monitor screen where the fruit is ripe or unripe based on image capture by webcam.
Sensor Method
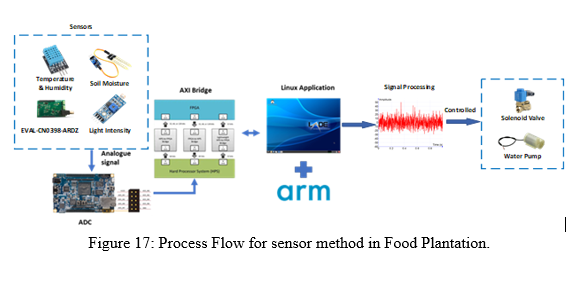
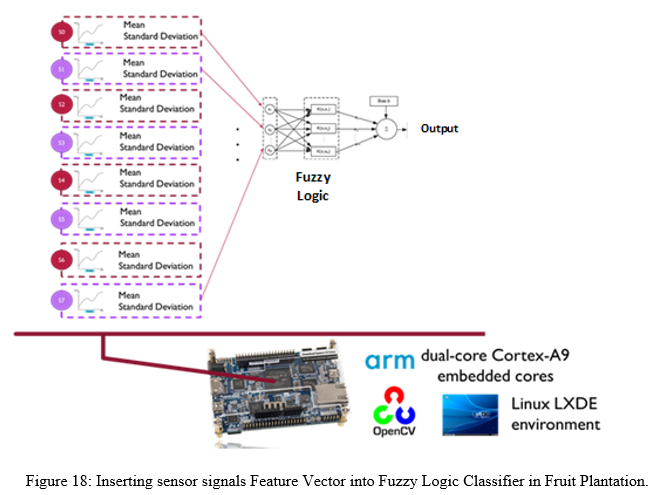
The sensor approach in Food Plantation used ADC, EVAL-CN0398-ARDZ, and other GPIOs to capture signal data and responses (as shown in Figure 17). The ADC pins of the DE10 Nano board are connected to the EVAL-CN0398-ARDZ. The reading signal from EVAL-CN0398-ARDZ initiates the process. After that, the signals are stored as a CSV file. Each signal's mean and standard deviation are computed, and the signals are then converted into feature vectors (as shown in Figure 18). For training and model testing, the feature vector is inserted into the Fuzzy Logic algorithm. Using trained signals from EVAL-CN0398-ARDZ, Fuzzy Logic will monitor, classify, and notify when the environments satisfy certain parameters, such as low soil moisture level or high pH value.
In Food Warehouse, the sensor method is focused on THREE (3) methods which are a) Odour Method, b) Capacitive Method, and c) Hybrid (Integrated) Method.
Odour Method
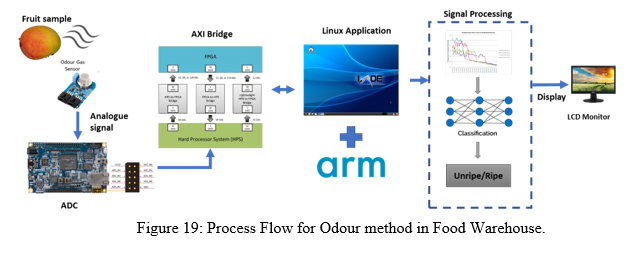
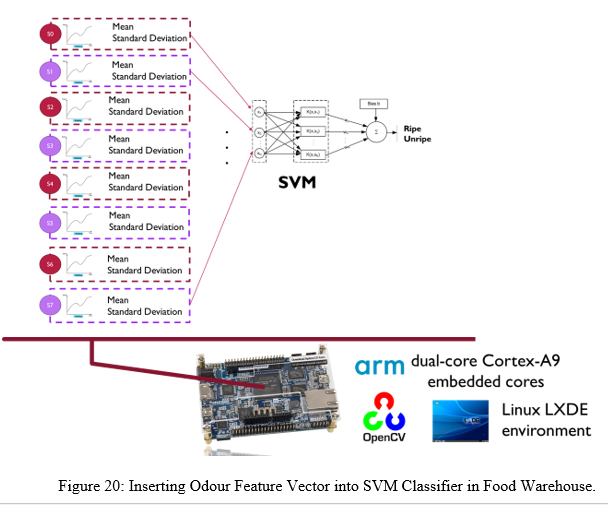
The tools used for this Odour Method are eight Odour Gas Sensor (OGS) Array (as shown in Figure 19). The OGS is connected to ADC pins on DE10 Nano board. The process starts with the reading signal from OGS. Then, the captured odour signal is saved into CSV file. Mean and standard deviation of each odour signal is calculated and then convert the signals into feature vector (as shown in Figure 20). The feature vector is insert into Support Vector Machine (SVM) algorithm for training and model testing. SVM will classify the fruit whether ripe or unripe using trained odour signal.
Capacitive Method
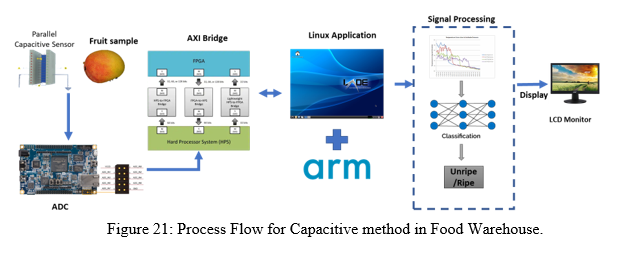
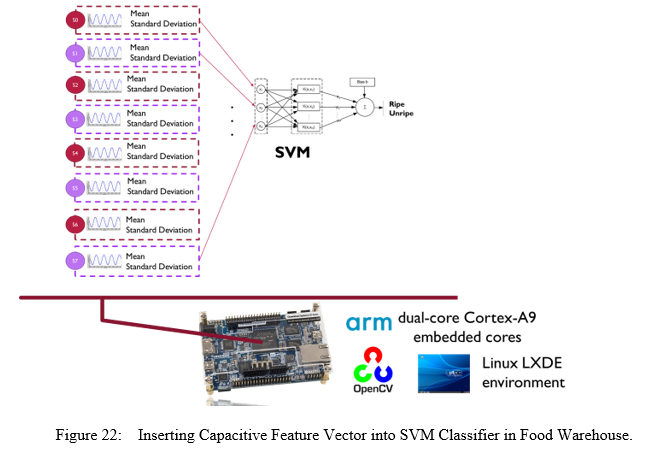
Capacitive method is focused on dielectric constant from fruit. This process needs two parallel capacitive plates (8 pins) to work perfectly. Fruit is placed between the two parallel capacitive plates. Then, DE 10 Nano will read parallel capacitive plate signal via ADC pins. The signals are saved into CSV file and display the signal value captured on monitor. Mean and standard deviation of each signal are calculating before convert all signals into feature vector as shown in Figure 21. Next, feature vector is insert into Support Vector Machine (SVM) algorithm for training and model testing (as shown in Figure 22). SVM will classify whether the fruit is ripe or unripe using trained capacitive signal and display the output on LCD monitor screen.
Hybrid (Integrated) Method
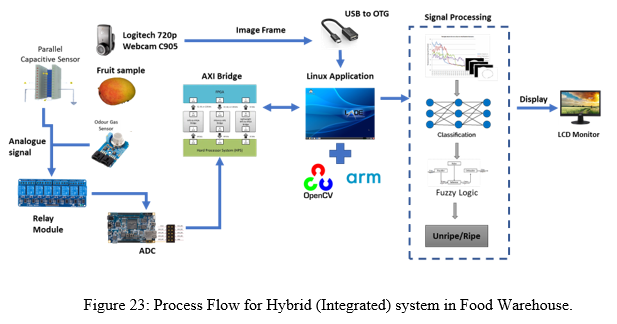
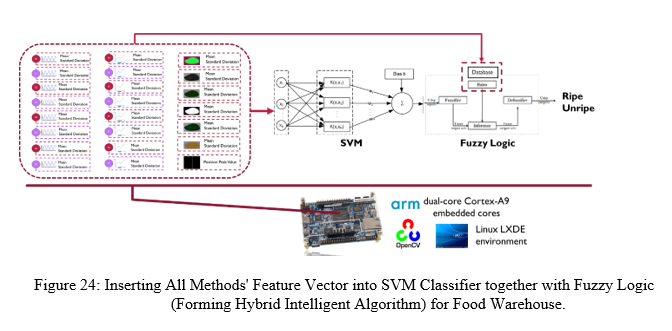
This hybrid method is to integrate image, odour and capacitive method into a one system. This method using three methods to determine the ripeness of fruit. The fruit will test by capturing image using webcam, sense the aroma of fruit using odour gas sensors and read dielectric constant using capacitive plate (see Figure 23). The data of all method convert into feature vector. Then, feature vector is insert into SVM classifier together with Fuzzy Logic to form hybrid intelligent algorithm that will determine the ripeness of fruit as shown in Figure 24.
The hybrid intelligent algorithm model share data structures and knowledge representations by put together multiple techniques and emphasis on their collaboration in a problem-solving task. This method allows to integrate alternative techniques and exploit their mutuality. This mutuality can be emphasizing more clearly by implementing in parallel computing in DE10 Nano.
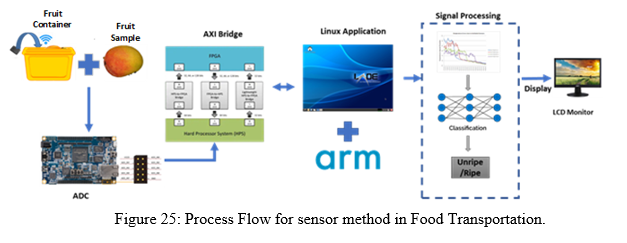
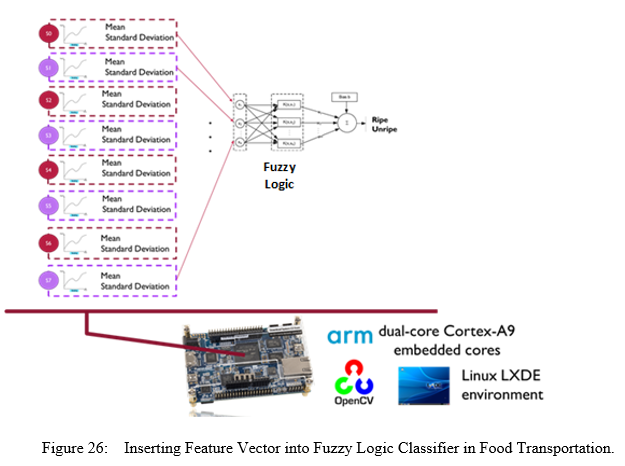
The sensor approach for Food Transportation used ADC, RFS, and GPS to collect data on location, temperature, humidity, gas concentration, and maturity stage as shown in Figure 25. These modules are attached to the DE10 Nano board's ADC pins. The reading of signals from modules is the first step in the procedure. After that, the signals are stored as a CSV file. Each signal's mean and standard deviation are calculated, and the signals are then converted into feature vectors as shown in Figure 26. For training and model testing, the feature vector is inserted into the Fuzzy Logic algorithm. Fuzzy Logic will classify the signals in order to adjust the cooler's temperature using Fuzzy Logic's learned data.
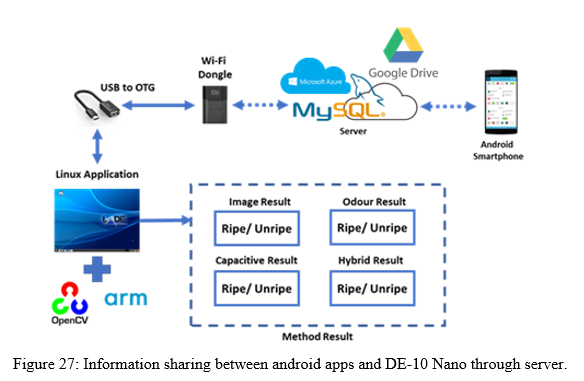
Information Sharing through IoT technology using Mobile Application
In this project, integration between IoT technology is implemented using MySQL server, Microsoft Azure, Google Drive, Wi-Fi dongle, and also android smartphone (as shown in Figure 27). Android smartphone retrieved the information about the result for each method from MySQL/Microsoft Azure/Google Drive server and at the same time it also able to send the control signal to the DE-10 Nano for choosing the method. Android smartphone also has other functionalities, including plantation management, fruit maturity monitoring, food warehouse monitoring, food transportation monitoring, species recognition, plant irrigation, pest detection, and early plant disease detection.
6. Performance metrics, performance to expectation
In food plantation, there are several important parameters that affect the crop growth, such as:
- Physical
- The Food Plantation system consist a lot of sensors such as pH sensor, soil moisture sensor, temperature and humidity sensor, light intensity sensor, and water level sensor.
- Chemical (Carbon dioxide)
- Presence of pest, weed, and early plant disease
- This system can detect the pest, weeds, and early plant disease using image processing technique.
- Maturity stage
- This system includes an automated scheduling system for monitoring the maturity stage based on calculated dates.
For Food Warehouse,
Parameter:
- Size
- As long as the fruit fits inside the grading conveyor, this method can determine the ripeness of numerous fruits without taking into account their size.
- Colour
- Using image processing techniques, this system can evaluate the maturity level of fruit based on colour change.
- Bruise
- Using an image and capacitive approach, this system can detect the bruised area of a fruit.
For Food Transportation,
Parameter:
- Fruit condition
- During transportation in the container, the condition of the fruit is kept at a consistent level of maturity.
- Container condition
- To monitor and manage the environment within the container during transportation, the container has a planar sensor, odour sensor, RFS, and thermoelectric cooler.
7. Sustainability results, resource savings achieved
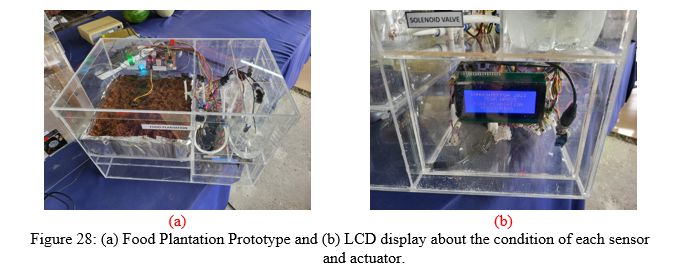
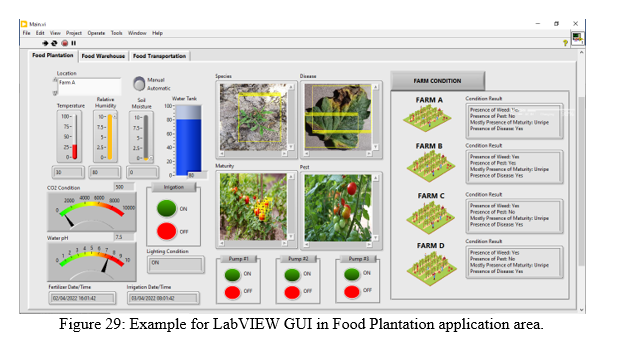
In order to measure the performance metric, the project has developed THREE prototypes to perform simulation scenarios based on THREE different application areas. In Food Plantation, the prototype (as shown in Figure 28 (a)) consists of the several sensors and actuators, which use for collecting and controlling the environment in plantation. Figure 28 (b) also shows the LCD display about the parameter data collected from sensors and the action performed by actuators. Besides that, the LabVIEW Graphical User Interface (GUI) in also developed for data visualization purpose. In LabVIEW GUI in Figure 29, the images captured from DE10-Nano is processed and constructing the bounding box for showing the location presence of pest, weed, disease and fruit maturity stage. At the meantime, the GUI also display the overall result for each farm information.
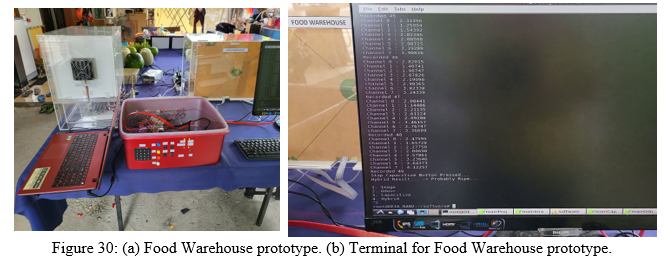
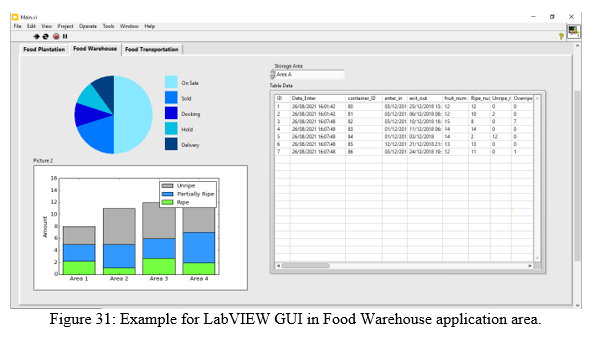
In Food Warehouse, the prototype (as shown in Figure 30 (a)) consists of the camera, odour sensors, and capacitive plate, which use to determine the ripeness level of the fruits in warehouse. Figure 30 (b) also shows the terminal of the Food Warehouse. Besides that, the LabVIEW Graphical User Interface (GUI) in also developed for data visualization purpose. In LabVIEW GUI in Figure 31, the images captured from DE10-Nano is processed and display the information about Food Warehouse status for each area. At the meantime, the GUI also display the detailed information about Food Warehouse for each area.
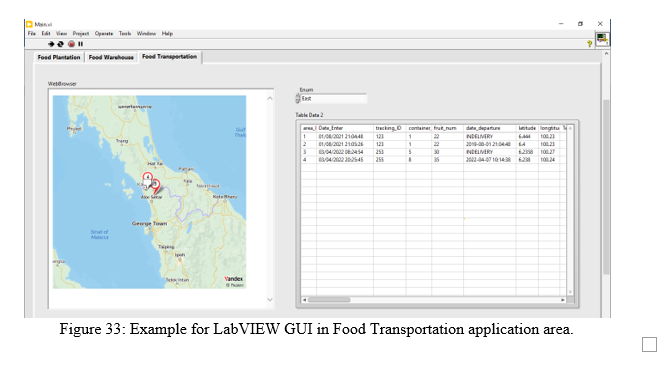
In Food Transportation, the prototype (as shown in Figure 32 (a)) consists of the odour sensor, RFS, planar sensor, and thermoelectric cooloer, which use to monitor and control the ripeness level of the fruits during transportation. Figure 30 (b) also display the information such as location, humidity, temperature, and gas response in the LCD of the Food Transportation prototype. Besides that, the LabVIEW Graphical User Interface (GUI) in also developed for data visualization purpose. In LabVIEW GUI in Figure 33, the images captured from DE10-Nano is processed and display the information about container status during transportation. At the meantime, the GUI also display the detailed information about Food Transportation for each container.

Information Sharing through IoT technology using Mobile Application
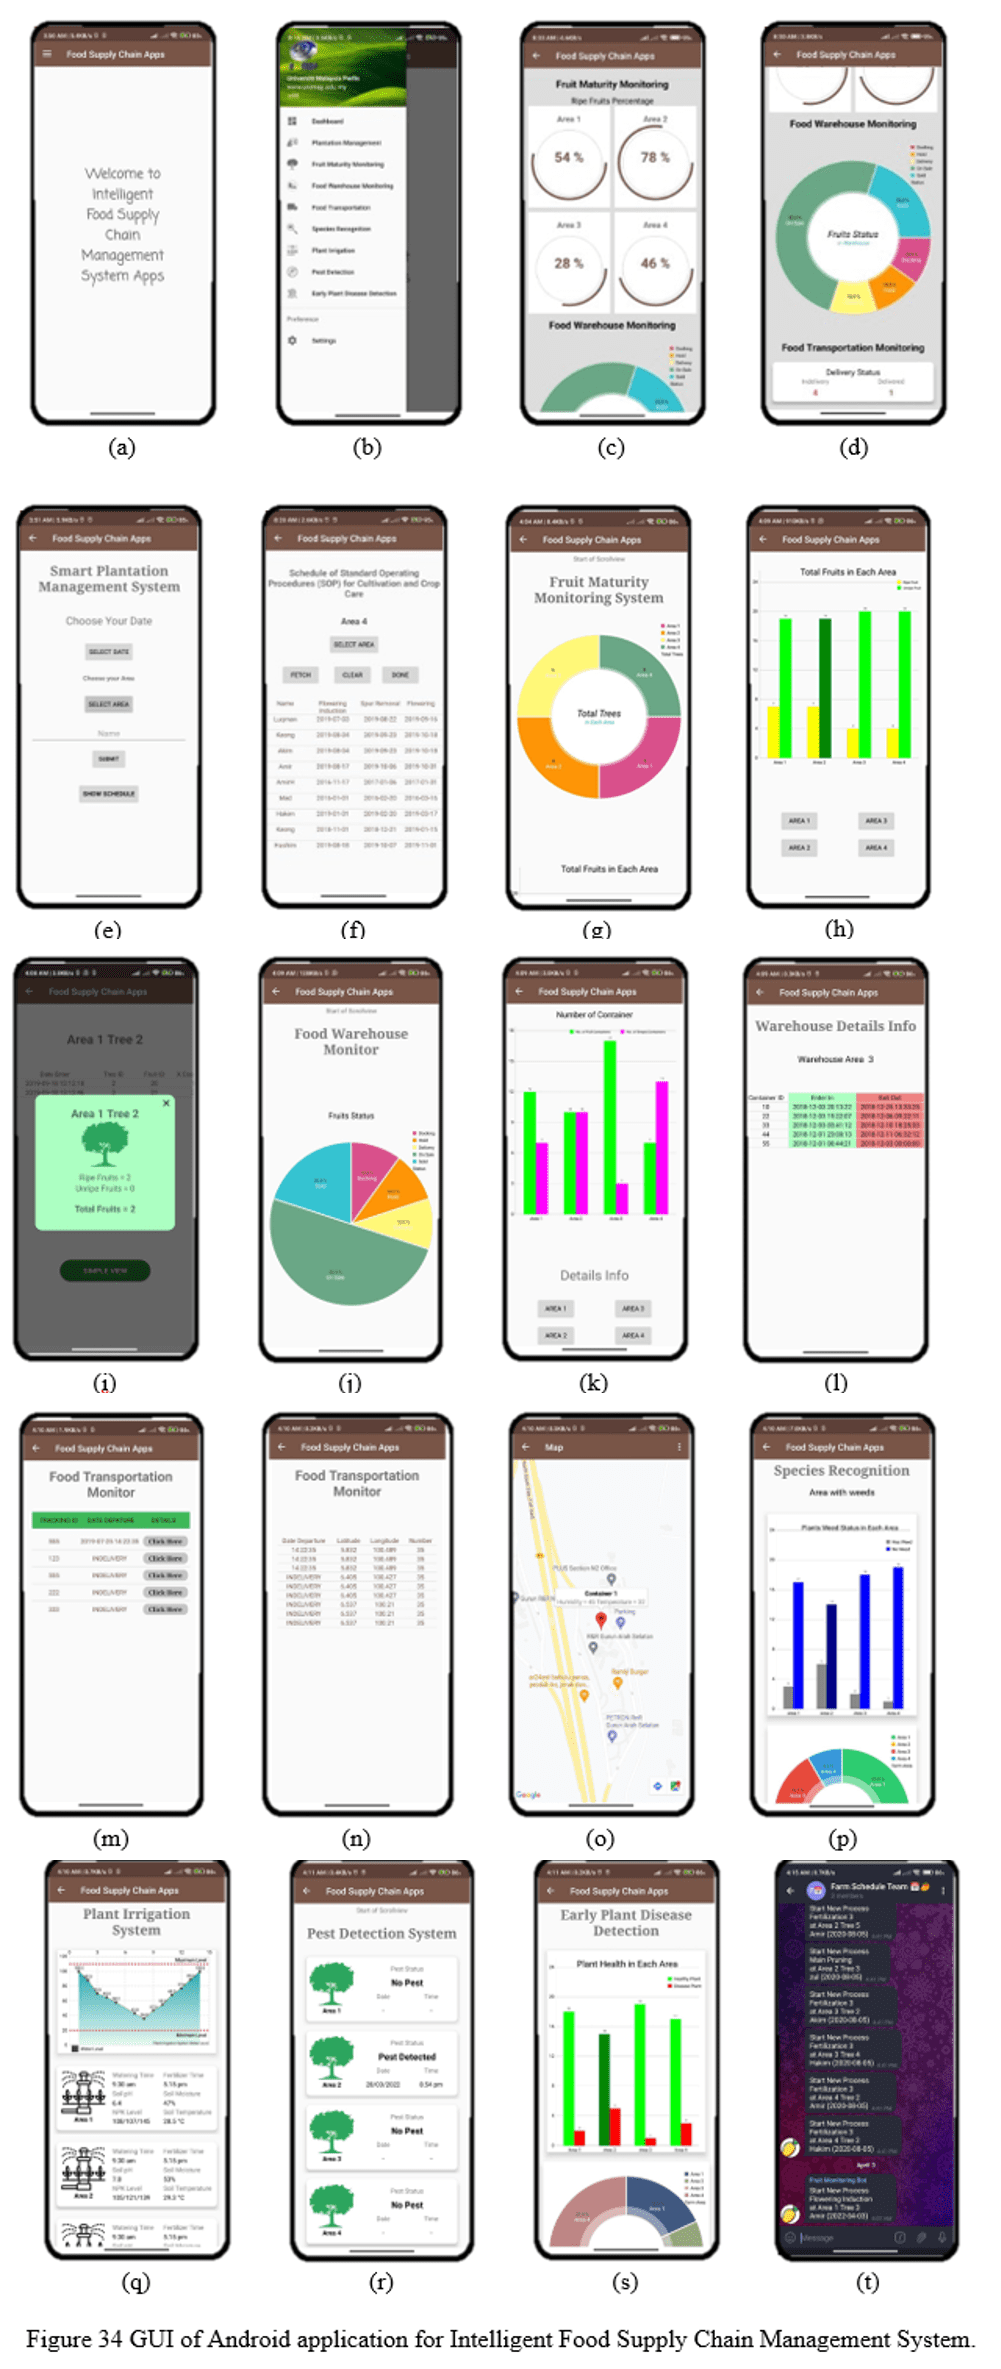
This integration between DE-10 Nano and smartphone through MySQL server, such as plantation management, fruit maturity monitoring, food warehouse monitoring, food transportation monitoring, species recognition, plant irrigation, pest detection, and early plant disease detection is successfully implemented as shown in Figure 34. Figure (a) shows the welcome page of this apps and Figure (b) displays the list of menus in this apps. Figure (c) and (d) is the dashboard graphical user interface (GUI) for overall system that consist of information from farm, warehouse, and transportation. Next, Figure (e) and (f) display the information about Smart Plantation Management System which is the schedule of standard operating procedures (SOP) for cultivating and crop care. Then, Figure (g), (h), and (i) display the status and information of fruit ripeness in the farm. Meanwhile, Figure (j), (k), and (l) display the status and information of food in the warehouse. Then, Figure (m), (n), and (o) shows the information, status, and real-time location of food during transportation process. Figure (p) display the statistical information about weeds at the plant areas. Next, Figure (q) shows the information and status about irrigation system such as pH level, soil moisture, watering level, and others. Figure (r) display the status of pest that have been detected in the farm while Figure (s) shows the information about early plant disease detection. Lastly, Figure (t) shows the Telegram notification is send from this apps to alert the user to execute the task.
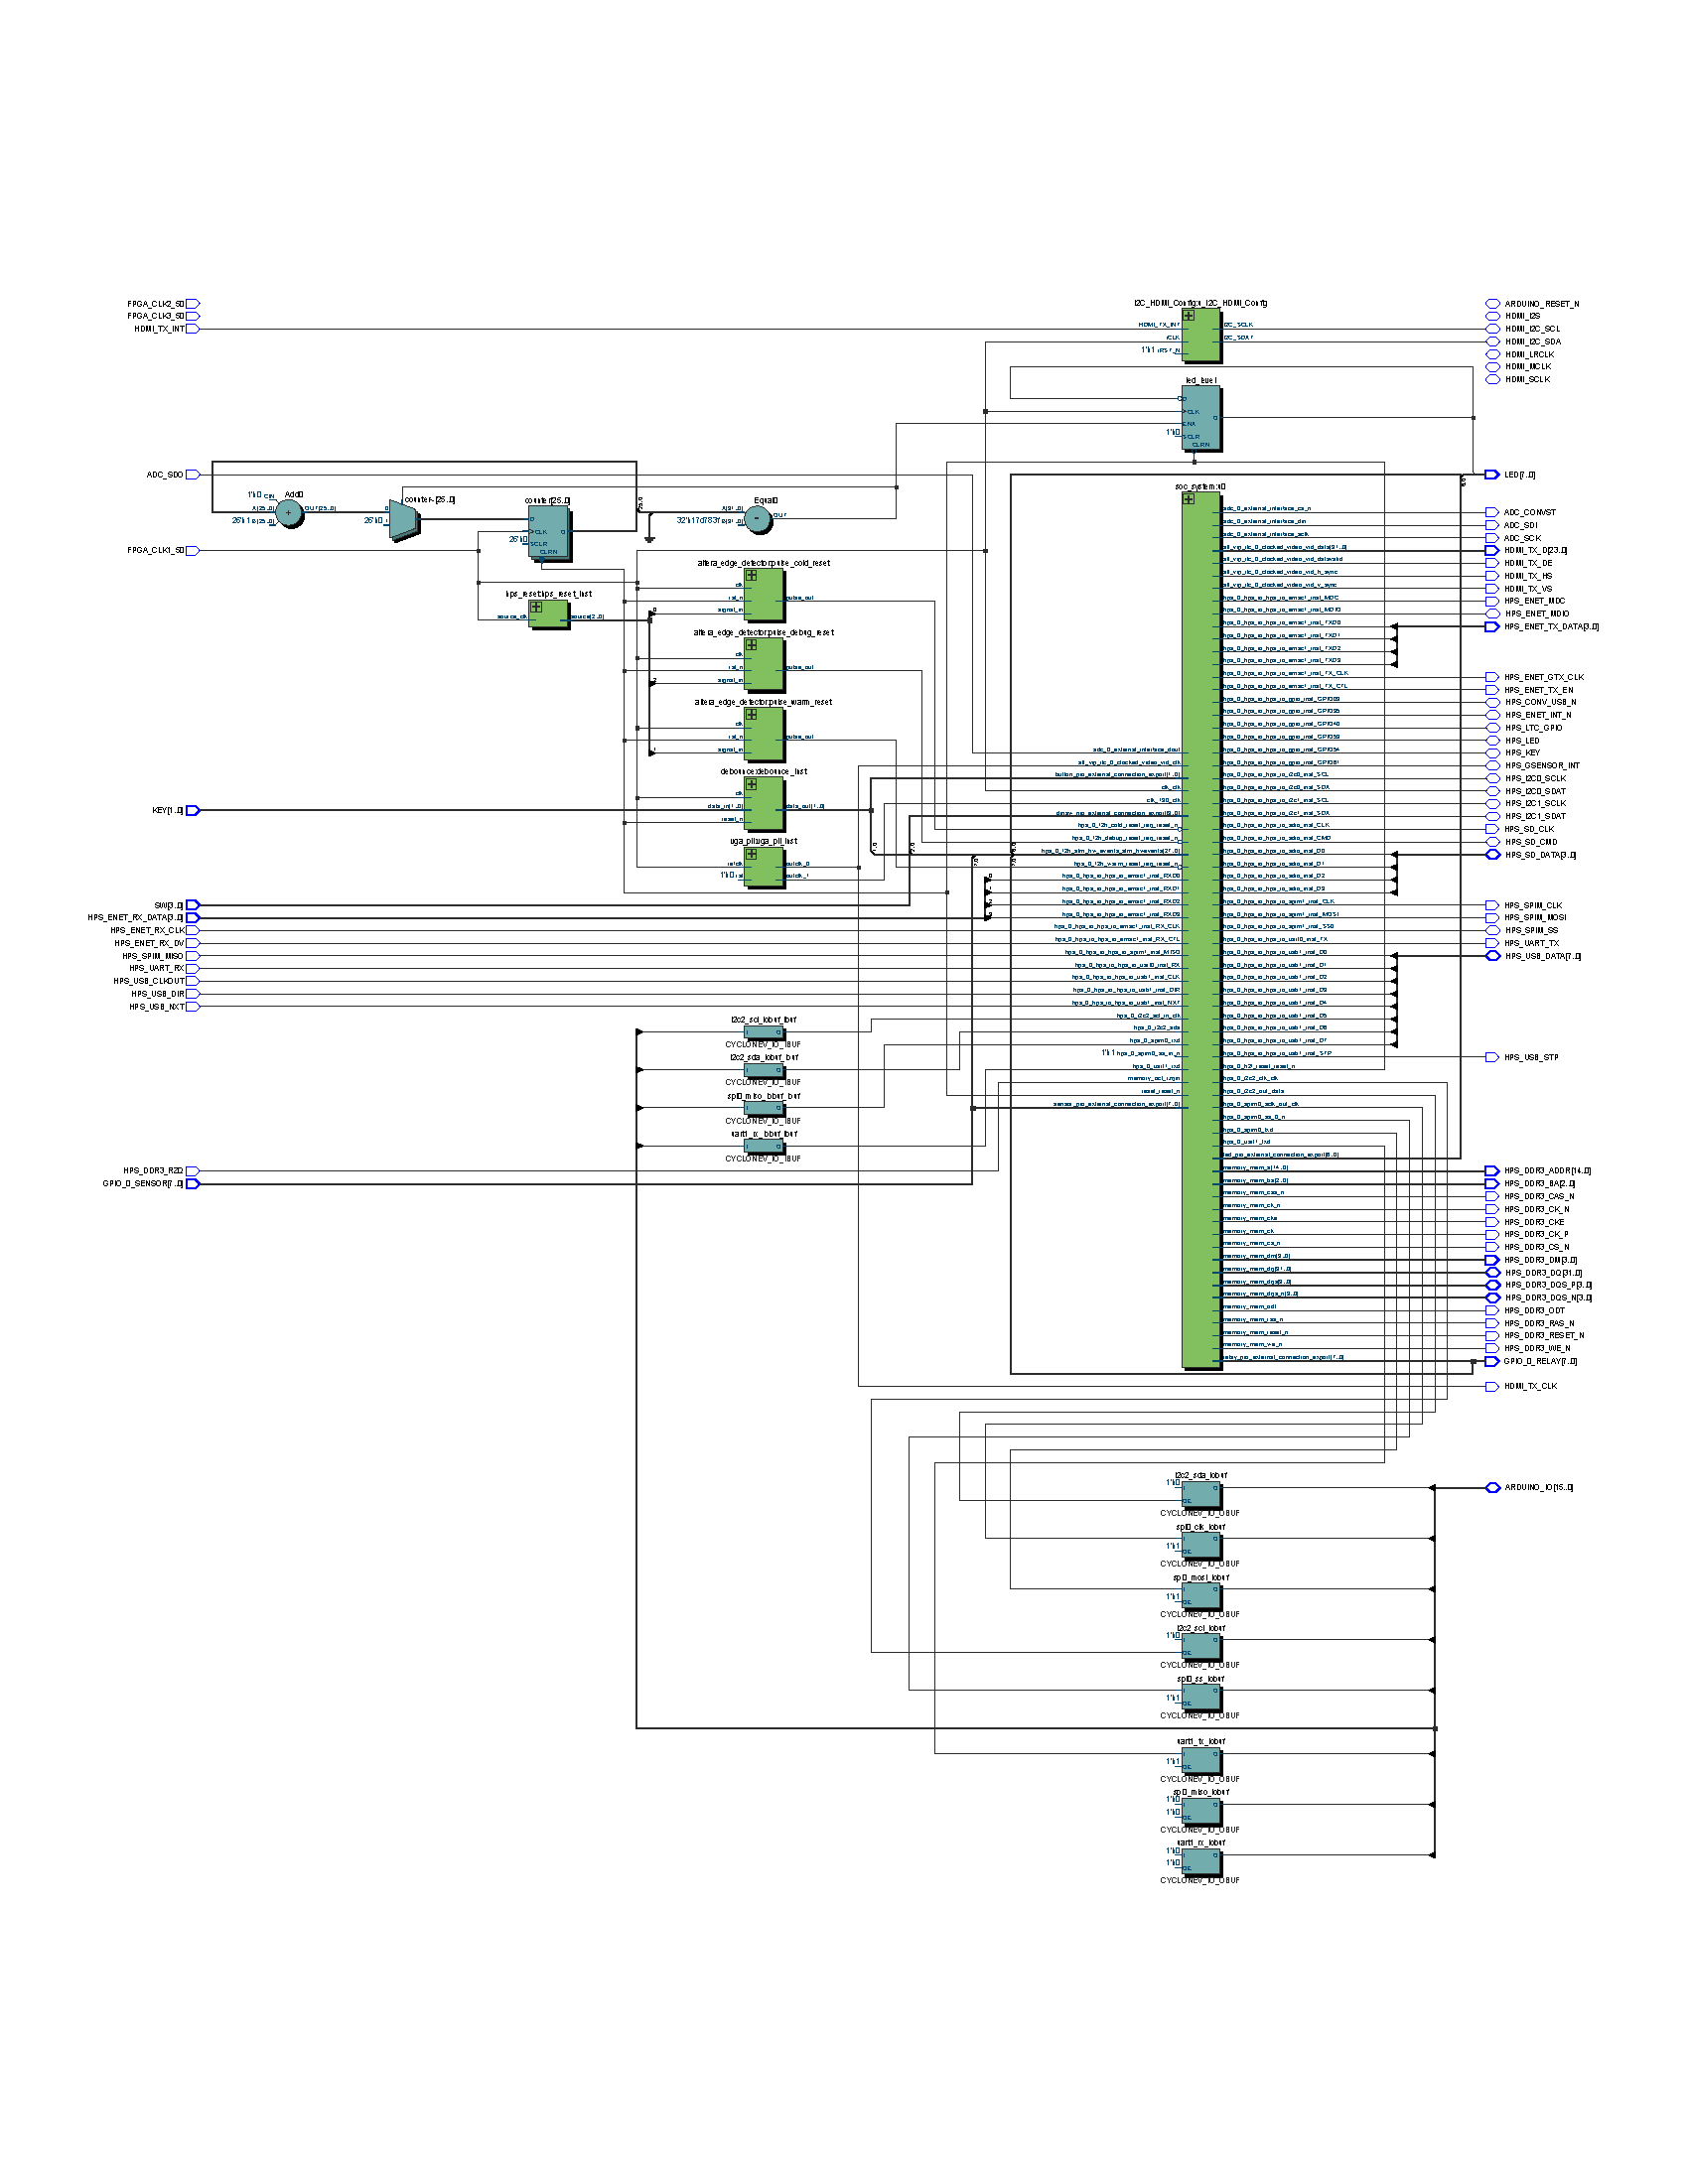
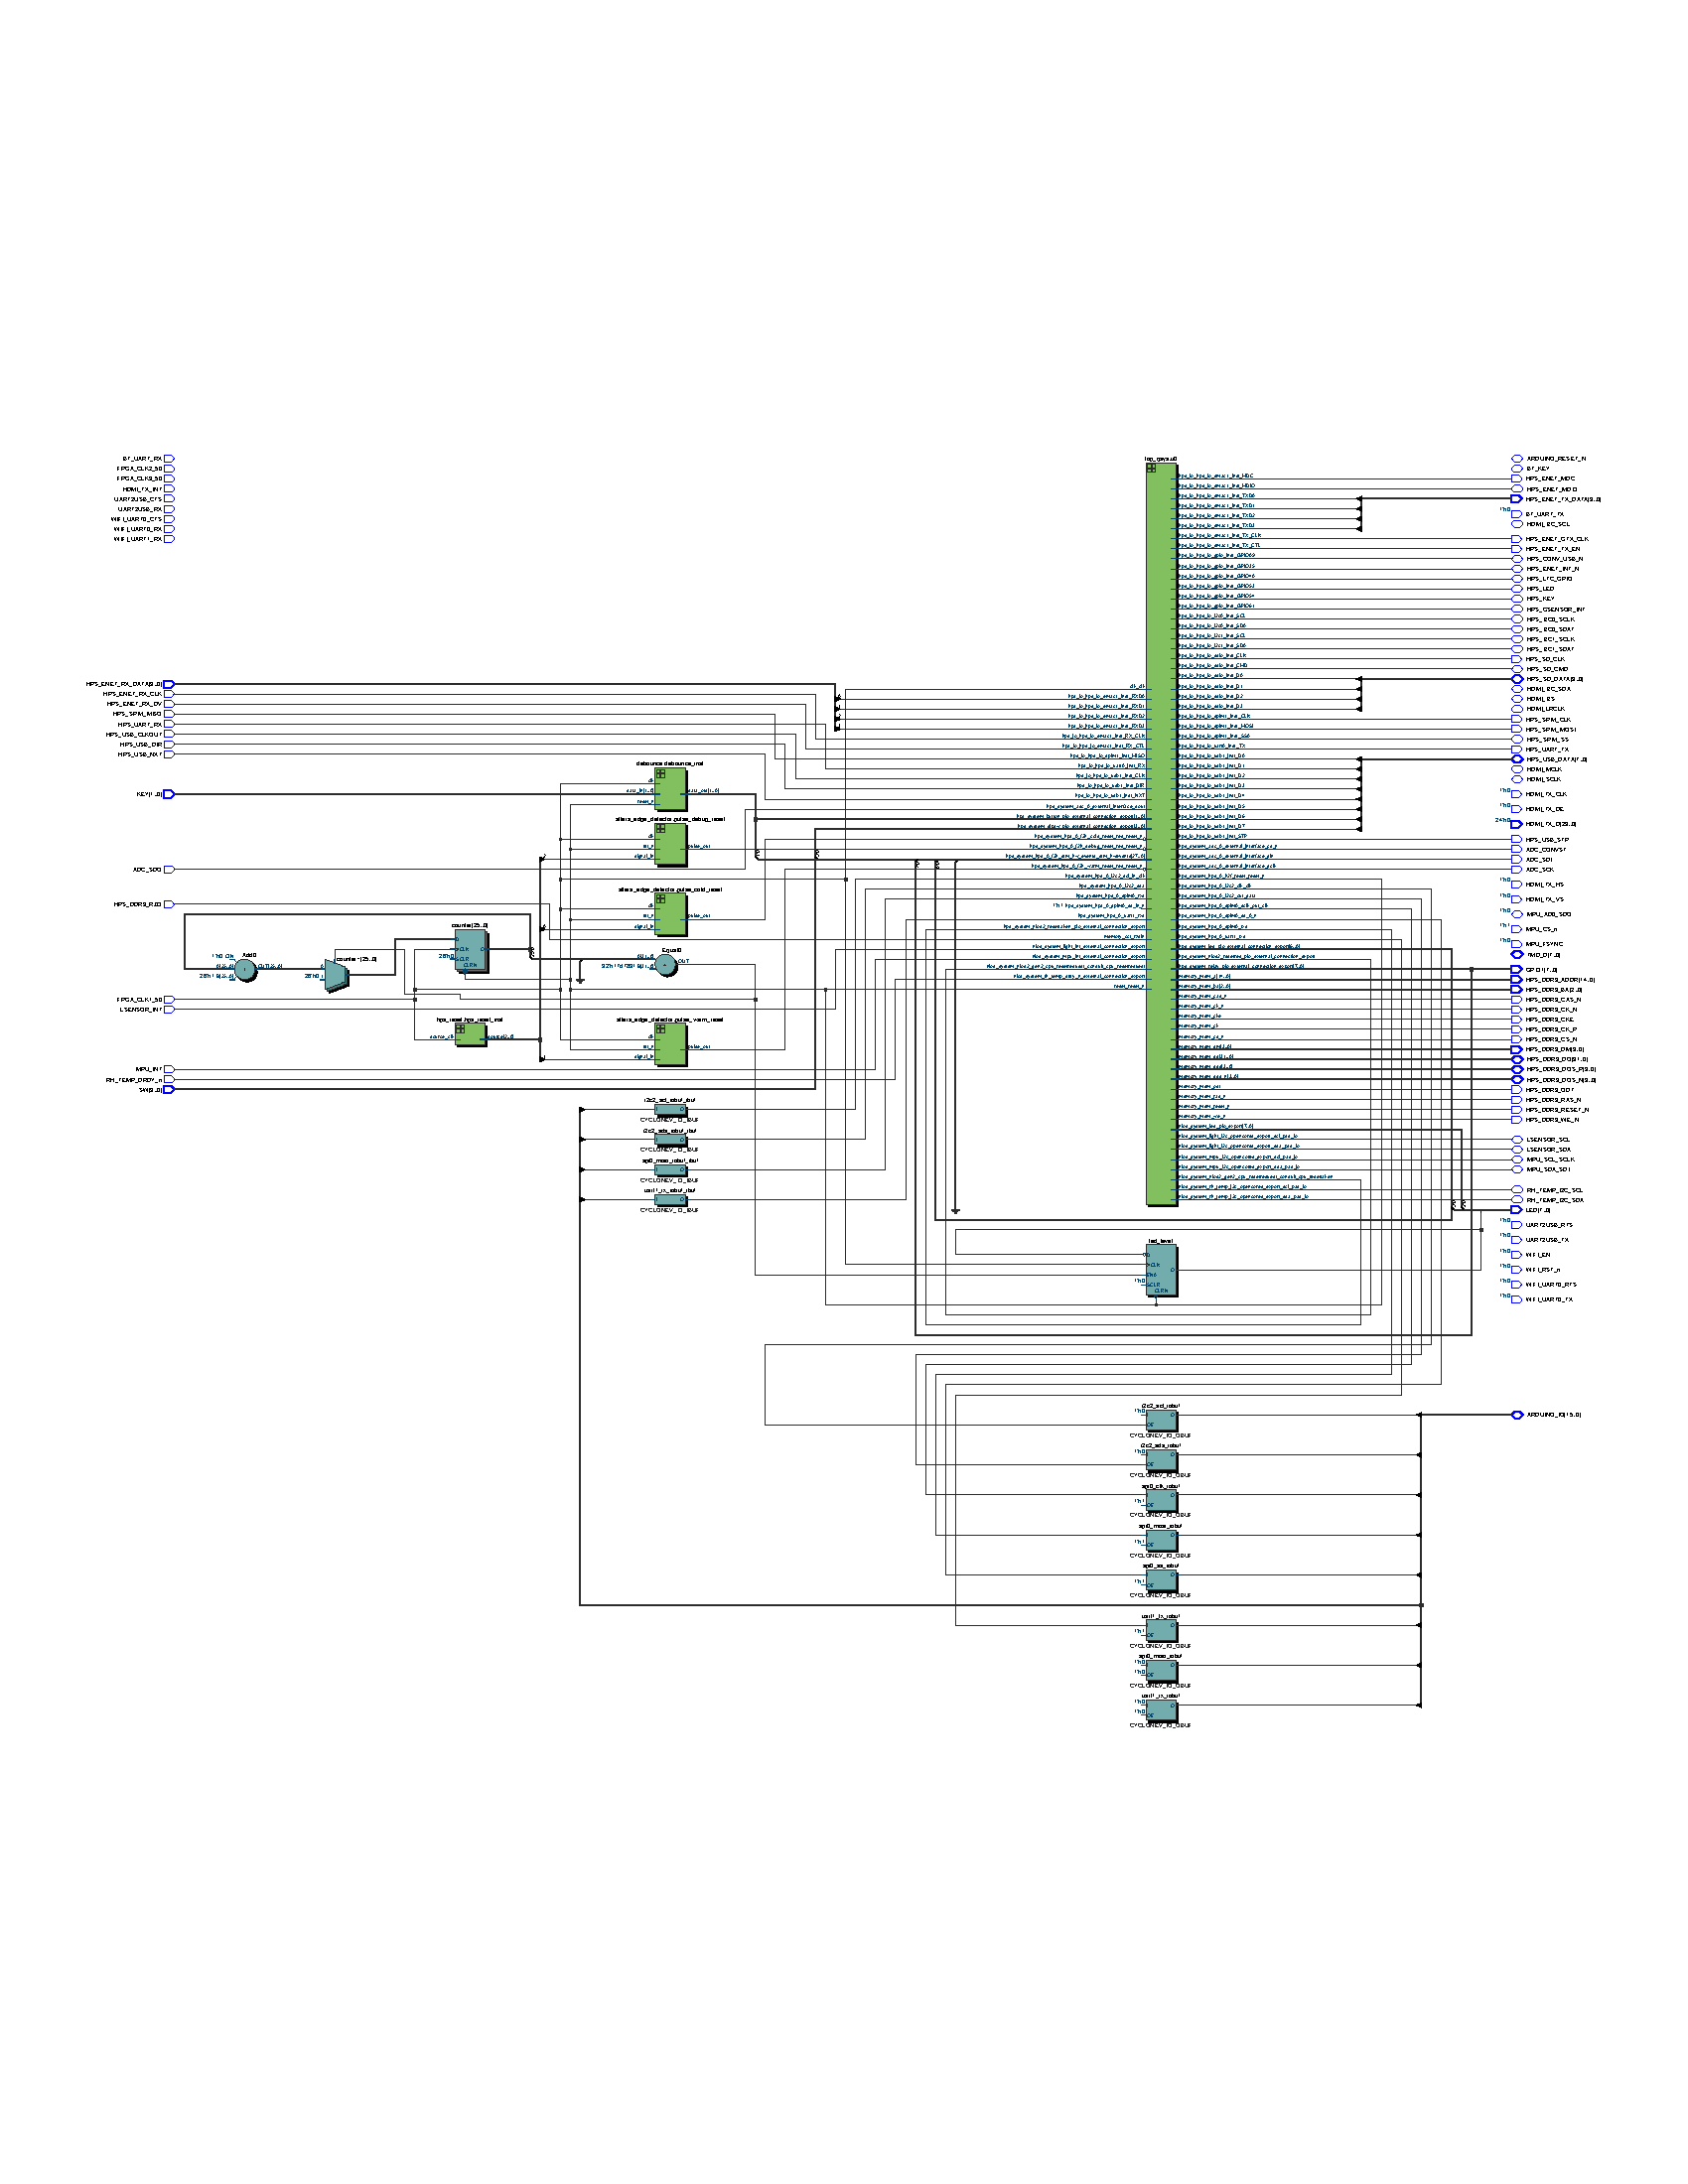
RTL for food plantation
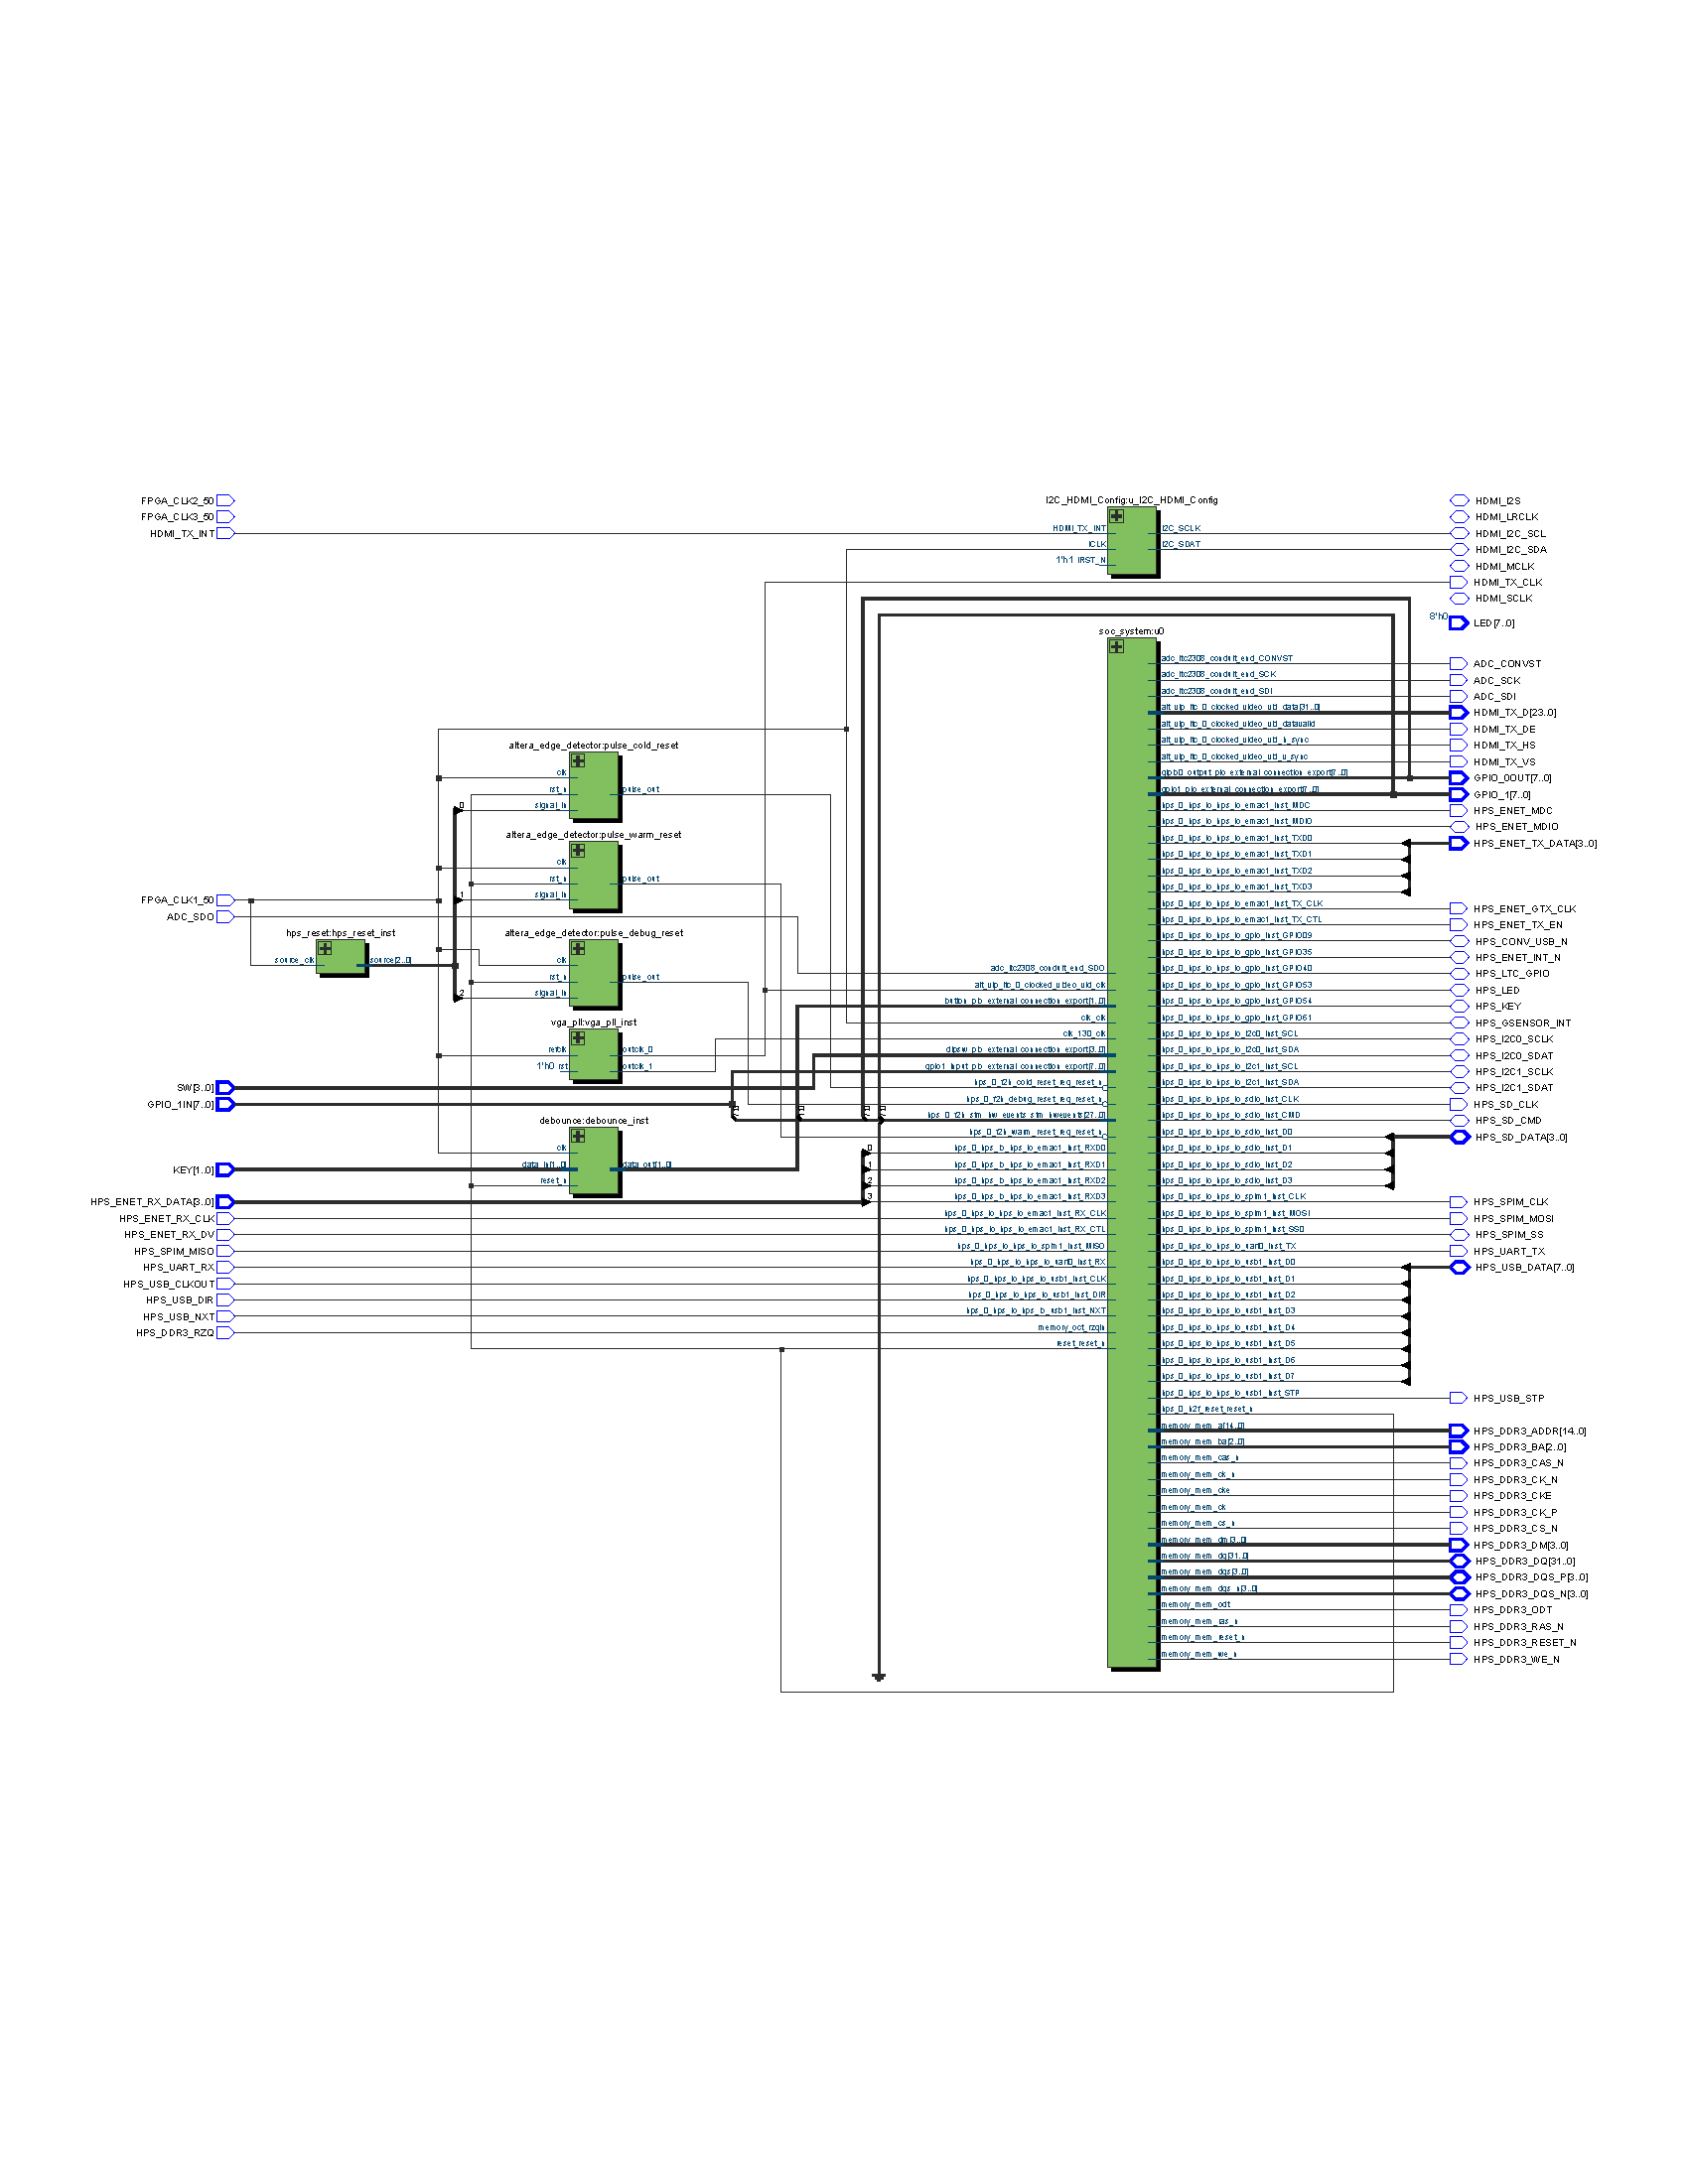
RTL for food warehouse
RTL for food transportation
8. Conclusion
This project will contribute to the overall goal of assisting users, particularly those in the agriculture sector who have limited expertise and knowledge of the food supply chain management system. As a result of this project, the quality of foods produced in the agricultural sector will improve. This project also has the advantage of being able to send and receive data from a server utilising IoT technology and display it in mobile applications such as Android Apps. This project has a lot of commercial potential, even if it's not tied to agriculture. Irrigation system, logistic management and tracking system, warehouse management system, and so on are examples of these applications.
References
- Terasic DE10-Nano Kit, https://www.terasic.com.tw/cgi-bin/page/archive.pl?Language=English&CategoryNo=205&No=1046&PartNo=4
- Android Studio Development Tools, https://developer.android.com/
- MySQL Server Wiki, https://community.oracle.com/community/groundbreakers/database/my-sql
- Terasic DE10-Nano Get Started Guide, https://software.intel.com/en-us/terasic-de10-nano-get-started-guide
0 Comments
Please login to post a comment.