This project aims to develop an always-on device that measures raw energy usage at the ingress power line (current, voltage), processing of this realtime data (PF etc.) and transmitting the processed data via WiFi to the internet or locally.
Scope is as below,
FPGA:
- Code that collects and process raw values from ADC.
- Code that interfaces with the ESP32
ESP32:
- Code that interfaces with the cloud
Server backend:
- Code that runs on the cloud that collects data from these ESP32s.
Frontend:
- Simple dashboard that displays current and historical energy usage.
Hardware scope is as bellow:
1. Analog interfacing circuit that interfaces the FPGA to the powerline.
Demo Video
Project Proposal
1. High-level project introduction and performance expectation
As the world slowly transitions into alternative energy source, it is becoming ever more important to optimize our power consumption as electrical energy will become more expensive to produce. In order to achieve that goal, having insights into energy consumption is important as it can help steer us towards making energy efficient decisions.
This project aims to develop an always-on device that measures raw energy usage at the ingress power line (current, voltage), processing of this realtime data (PF etc.) and transmitting the processed data via WiFi to the internet or locally.
The scope of the project includes the design of the interfacing circuit between the power line and ADCs of the FPGA, the communication protocol between the FPGA and ESP32, and transmission protocol between the ESP32 to the cloud, and a quick PoC of presenting this data from the cloud at a web browser.
Target users include power companies and electricity retail customers, meaning this project has the potential to scale to very big customer-base.
FPGA is chosen due to it's hard realtime capability, which is useful in high speed realtime data processing. In this application, the FPGA will sample the raw current and AC voltage at a sampling rate of >10kSps or much higher and process this data in realtime to give us power factor and power. In addition, by using FPGA we can have very fine control on sampling, which we can leverage to avoid timing attacks[1].
An advantage of using Intel FPGAs is that it comes with built-in high speed ADC which can be used directly for this application. Furthermore Intel FPGAs comes with AES encryption capability on the CFM, which will protect the firmware from being tampered when deployed to production.
[1] https://www.illinois.adsc.com.sg/resigate/papers/TSG18-False-Load-Attack.pdf
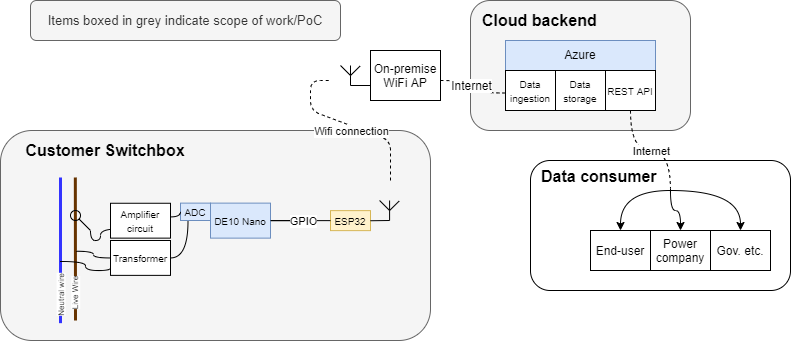
2. Block Diagram
3. Expected sustainability results, projected resource savings
When customers are armed with data of their energy usage through the use of this smart meter, they will self-regulate their lifestyles and habits to minimize energy usage because people do not want to pay too much for energy costs. This is even more relevant in the context of Singapore as the country is very sensitive to worldwide energy market costs due to being an importer of energy.
Furthermore, having a somewhat high speed (WiFi) connectivity enables low latency and high resolution streaming of realtime energy usage, either locally or to the internet. Some benefits of this may be:
- Energy retailers can bill for energy in smaller temporal blocks in the open energy market. In Singapore, households can opt to pay for energy at market rate, meaning they pay the raw $/kWh which fluctutates at 30 minutes blocks.
- Advanced customers can leverage this to ramp and plan their energy usage (by for example storing the energy) according to prevailing energy prices to maximize grid usage while minimizing energy costs.
In conclusion, energy usage will be better managed when users are given insights to their usage.
4. Design Introduction
In an electronic energy meter, the meter samples the live power line by means of an ADC and derives various metering parameters in discrete time.
In this project, the energy meter is realized with 3 main components:
- Interfacing circuit to the high voltage line
- Computation
- Transmitting of collected data
These components will be described below.
Interfacing circuit to the high voltage line
This is achieved by the use of an energy metering PCB. This PCB contains a shunt resistor that measures the current and resistor dividers to attenuate the incoming live voltage. The PCB also contain a few precision ADC chips that samples the voltage across the shunt resistor and voltage at the other end of the resistor dividers. ADC chips typically offer a digital interface such as SPI or I2C, which can be easily hooked up to the DE10 board.
Computation
Computation can be done on the FPGA, which is perfect for hard realtime measurement systems since it offers extremely low jitter, predictable and parallel execution of logic.
Once we have the necessary raw data from the ADC, we can then calculate various metrology feature like active energy, reactive energy and apparent energy calculation, current and voltage RMS and power factor.
On the FPGA, these derived metrology feature can be packed and then transmitted at a much lower rate, piecewise to the RFS daughterboard.
Transmitting of collected data
The ESP8266 receives the data from the FPGA and and then sends it to the internet via WiFi. The backend, for the purpose of this PoC, is a barebones websocket pubsub server that relays data sent by the ESP8266 to a list of subscribers. Clients receive live data from the ESP8266 is near-realtime at a rate of 3 - 4 updates per second.
5. Functional description and implementation
FPGA
In this iteration of design, only bare metal FPGA is used, i.e. no NIOS used on the DE10. An SPI Master block is implemented in VHDL in order to talk to the ADCs via SPI, and also to talk to the RFS daughterboard.
Measurement
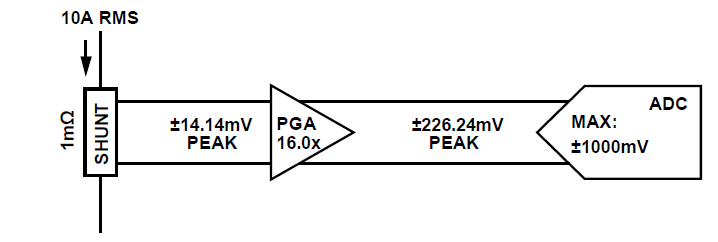
Input circuit with a shunt current sensor on current channel
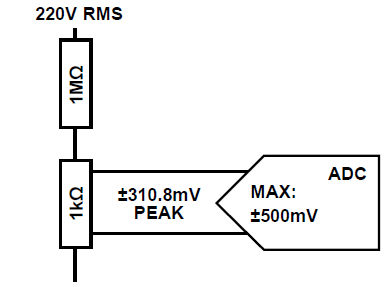
Input circuit with voltage sensed through a resistor divider
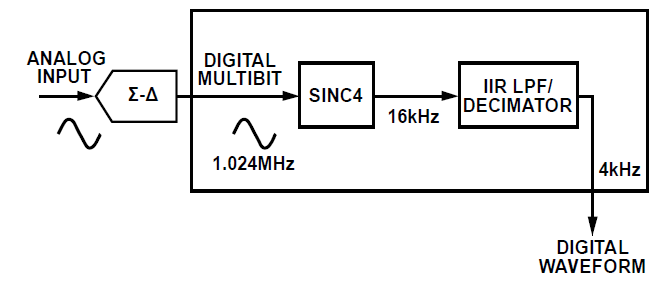
Datapath after ADC stage
The current channel ADC waveforms can be sampled at 4 kSPS, which is then passed through a infinite impulse response (IIR) and low-pass filter. Gain compensation are also applied. The current waveforms are used for total active power, IRMS, VA, and fundamental VAR calculations. Angle measurements indicate the time between the current channel zero crossings and the voltage channel zero crossings, with the results being updated at 512 kHz. A high-pass filter can be used to remove dc offsets for accurate rms and energy measurements.
The voltage channel ADC datapath is the same as the current channel.
Total active power is commonly used for billing purposes and includes power on the fundamental and on the harmonics. The total active power on each phase is calculated by first multiplying the current and voltage waveforms. Then, the result is low-pass filtered and gain corrected. The resulting wattage signal has an update rate of 4 kSPS.
Fundamental reactive power gives only the reactive power at the fundamental frequency of the signal. The current channel is shifted by 90degrees at the fundamental. This signal is then multiplied by the voltage waveform and the result is then low-pass filtered. For this fundamental measurement to work correctly, initialization of the network frequency and of the nominal voltage measured in the voltage channel is set to match domestic power parameters.
Apparent power is generated by multiplying the current rms measurement, by the corresponding voltage rms, AVRMS, and then applying a gain correction.
Instantaneous power measurements, including total active power, total apparent power and fundamental reactive power are updated at a rate of 4kSPS. These measurements are accumulated into power measurements internally.
The total active power and total apparent power are accumulated over 1.024 sec. The power factor measurement updates every 4096/4 kSPS = 1.024 sec.
RFS daughterboard
The nets WIFI_UART0_RTS, WIFI_UART0_CTS and WIFI_UART1_RX are repurposed for SPI comms. to the FPGA (MISO, MOSI, SCK). An additional net WIFI_IO4 was bridged with BT_UART_RX for nSS.
Micropython is flashed on the ESP8266, chosen for the ease of use which allows for fast prototyping. A Python script is written which handles the SPI communications, periodically requests for data and packing the data to be sent via websocket to a designated backend via WiFi over the internet.
Client
The client can be any browser capable of websocket communications. A simple single page HTML is written (using a CSS framework) with a bit of Javascript to handle the communication logic. The browser subscribes itself to the websocket channel and receives data verbatim from the ESP8266, parses and displays the data.
6. Performance metrics, performance to expectation
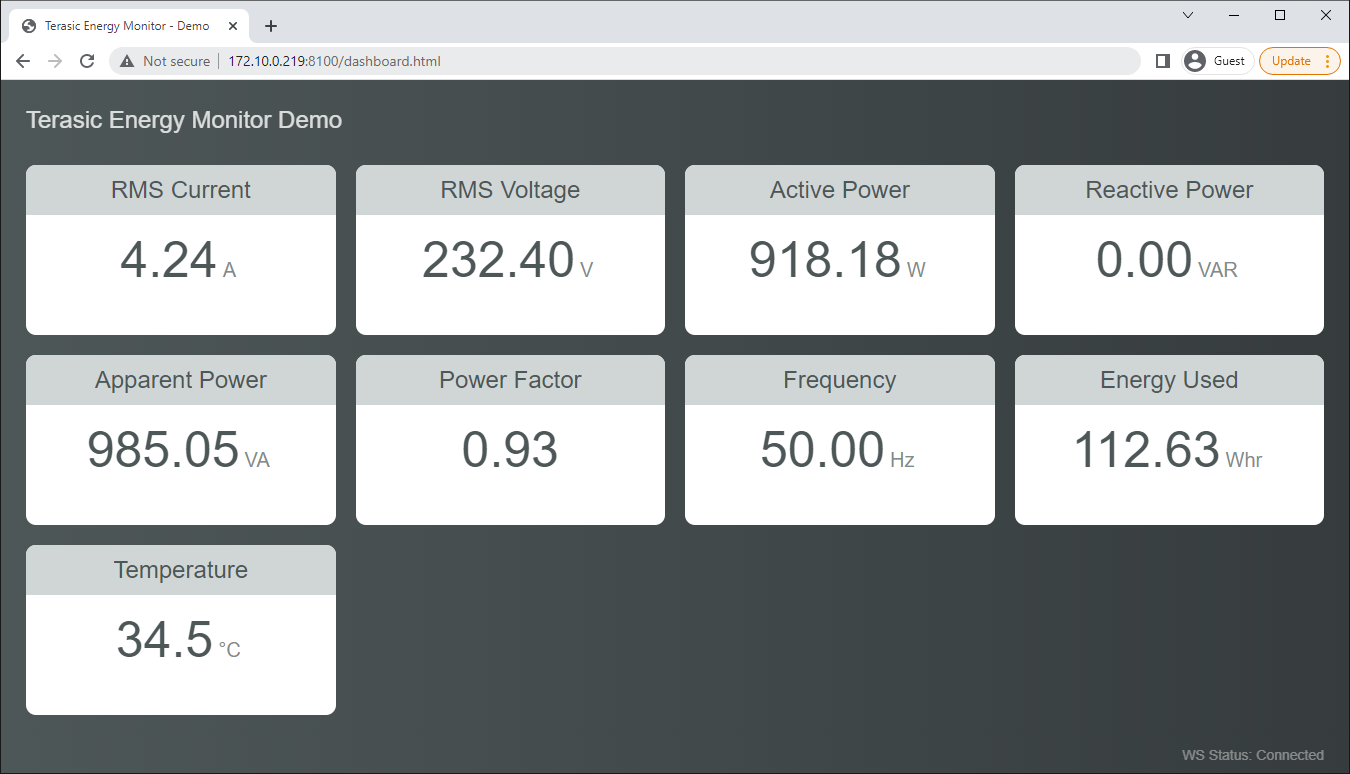
In this revision of the design, the device is capable of measuring a maximum of 10Arms at 240Vrms at a rate of 4kSPS. Actual metrology data rate achieved is around 3 to 4 updates per second at the receiving client, which is sufficient for realtime monitoring application. The rate and jitter of receipt is not critical because the actual measurements and calculations are done on-site at the FPGA/metering chip.
Picture below shows the screenshot of the dashboard at the client (a browser).
7. Sustainability results, resource savings achieved
With the use of an energy meter with realtime cloud reporting, a few benefits can be achieved:
- Eliminate the labor required to read the meter.
- Fast feedback loop to customer on energy usage, empowering the customer with necessary information to make swift decisions, e.g. identifying phantom power usage.
- Enable big data collection and analytics i.e. energy company can quickly identify trends and adjust supply.
8. Conclusion
In conclusion, a realtime energy monitoring and reporting meter has been realized with the DE10-Nano FPGA evaluation board and RFS daughterboard. The realtime reporting performance of the meter is within expectation, that is key energy metrology at 3 to 4 updates a second over WiFi, derived from 4kSPS raw sampling and calculation of line voltage and current. There is high confidence that the meter is accurate, however a more rigourous validation is required if production use is pursued.
0 Comments
Please login to post a comment.