A controlled environment minimizes the weather crop dependency, consequently, the hydroponic greenhouses increase the harvest quality and water management. Despite the benefits, this kind of crops requires a better knowledge in physiology and vegetal nutrition to understand the nutritional balance in order to implement chemical corrections in short-term periods. In addition, it is possible compare similar crops in a distributed way, but this fact does not allow and effective work from the field engineer. If the field engineer has access to crop information and its environment, he can apply preventive and corrective protocols to reduce toxicity damage from an element or improve the plant features for best product obtaining. Researchers would contrast between their results and farmers crops to develop action protocols and enhance vegetal genes. The data handling is the main task in this proposal. To get better workflow, an infrastructure that allow share information for crop analysis while engineer arrive and act will be implemented. In one hand, the main station, composed by DE10-Nano and signal conditioners, brings and interface between the user and cloud services to upload crop data. In the other hand, the cloud services allow remote interaction between the engineer and the crop without presential stand.
The station would use the FPGA to control the data acquisition and flow while the HPS monitors and interfaces the data with cloud services. The signal conditioners reduce the acquisition challenges for the pH, conductivity, relative humidity, light intensity, etc. From the sensors, the cloud services allow the storage, interpretation and provides Machine Learning tools to improve the information meaning.
Demo Video
Project Proposal
1. High-level project introduction and performance expectation
A controlled environment minimizes the weather crop dependency, consequently, the hydroponic greenhouses increase the harvest quality and water management. Despite the benefits, this kind of crops requires a better knowledge in physiology and vegetal nutrition to understand the nutritional balance in order to implement chemical corrections in short-term periods. In addition, it is possible compare similar crops in a distributed way, but this fact does not allow and effective work from the field engineer. In order to improve the workflow, an infrastructure for data sharing is implemented. This solution allows the field engineer analyze, plan, and act meanwhile arrive to the field. The Infrastructure is composed by the DE-10 nano board with the base software to communicate with the cloud. In addition, signal conditioners preprocess signal to be acquired to reduce errors in their interpretation and have a good measures.
The data handling is the main task in this proposal. To get better workflow, an infrastructure that allow share information for crop analysis while engineer arrive and act will be implemented. In one hand, the main station, composed by DE10-Nano and signal conditioners, brings and interface between the user and cloud services to upload crop data. In the other hand, the cloud services allow remote interaction between the engineer and the crop without presential stand. If the field engineer has access to crop information and its environment, he can apply preventive and corrective protocols to reduce toxicity damage from an element or improve the plant features for best product obtaining. Researchers would contrast between their results and farmers crops to develop action protocols and enhance vegetal genes.
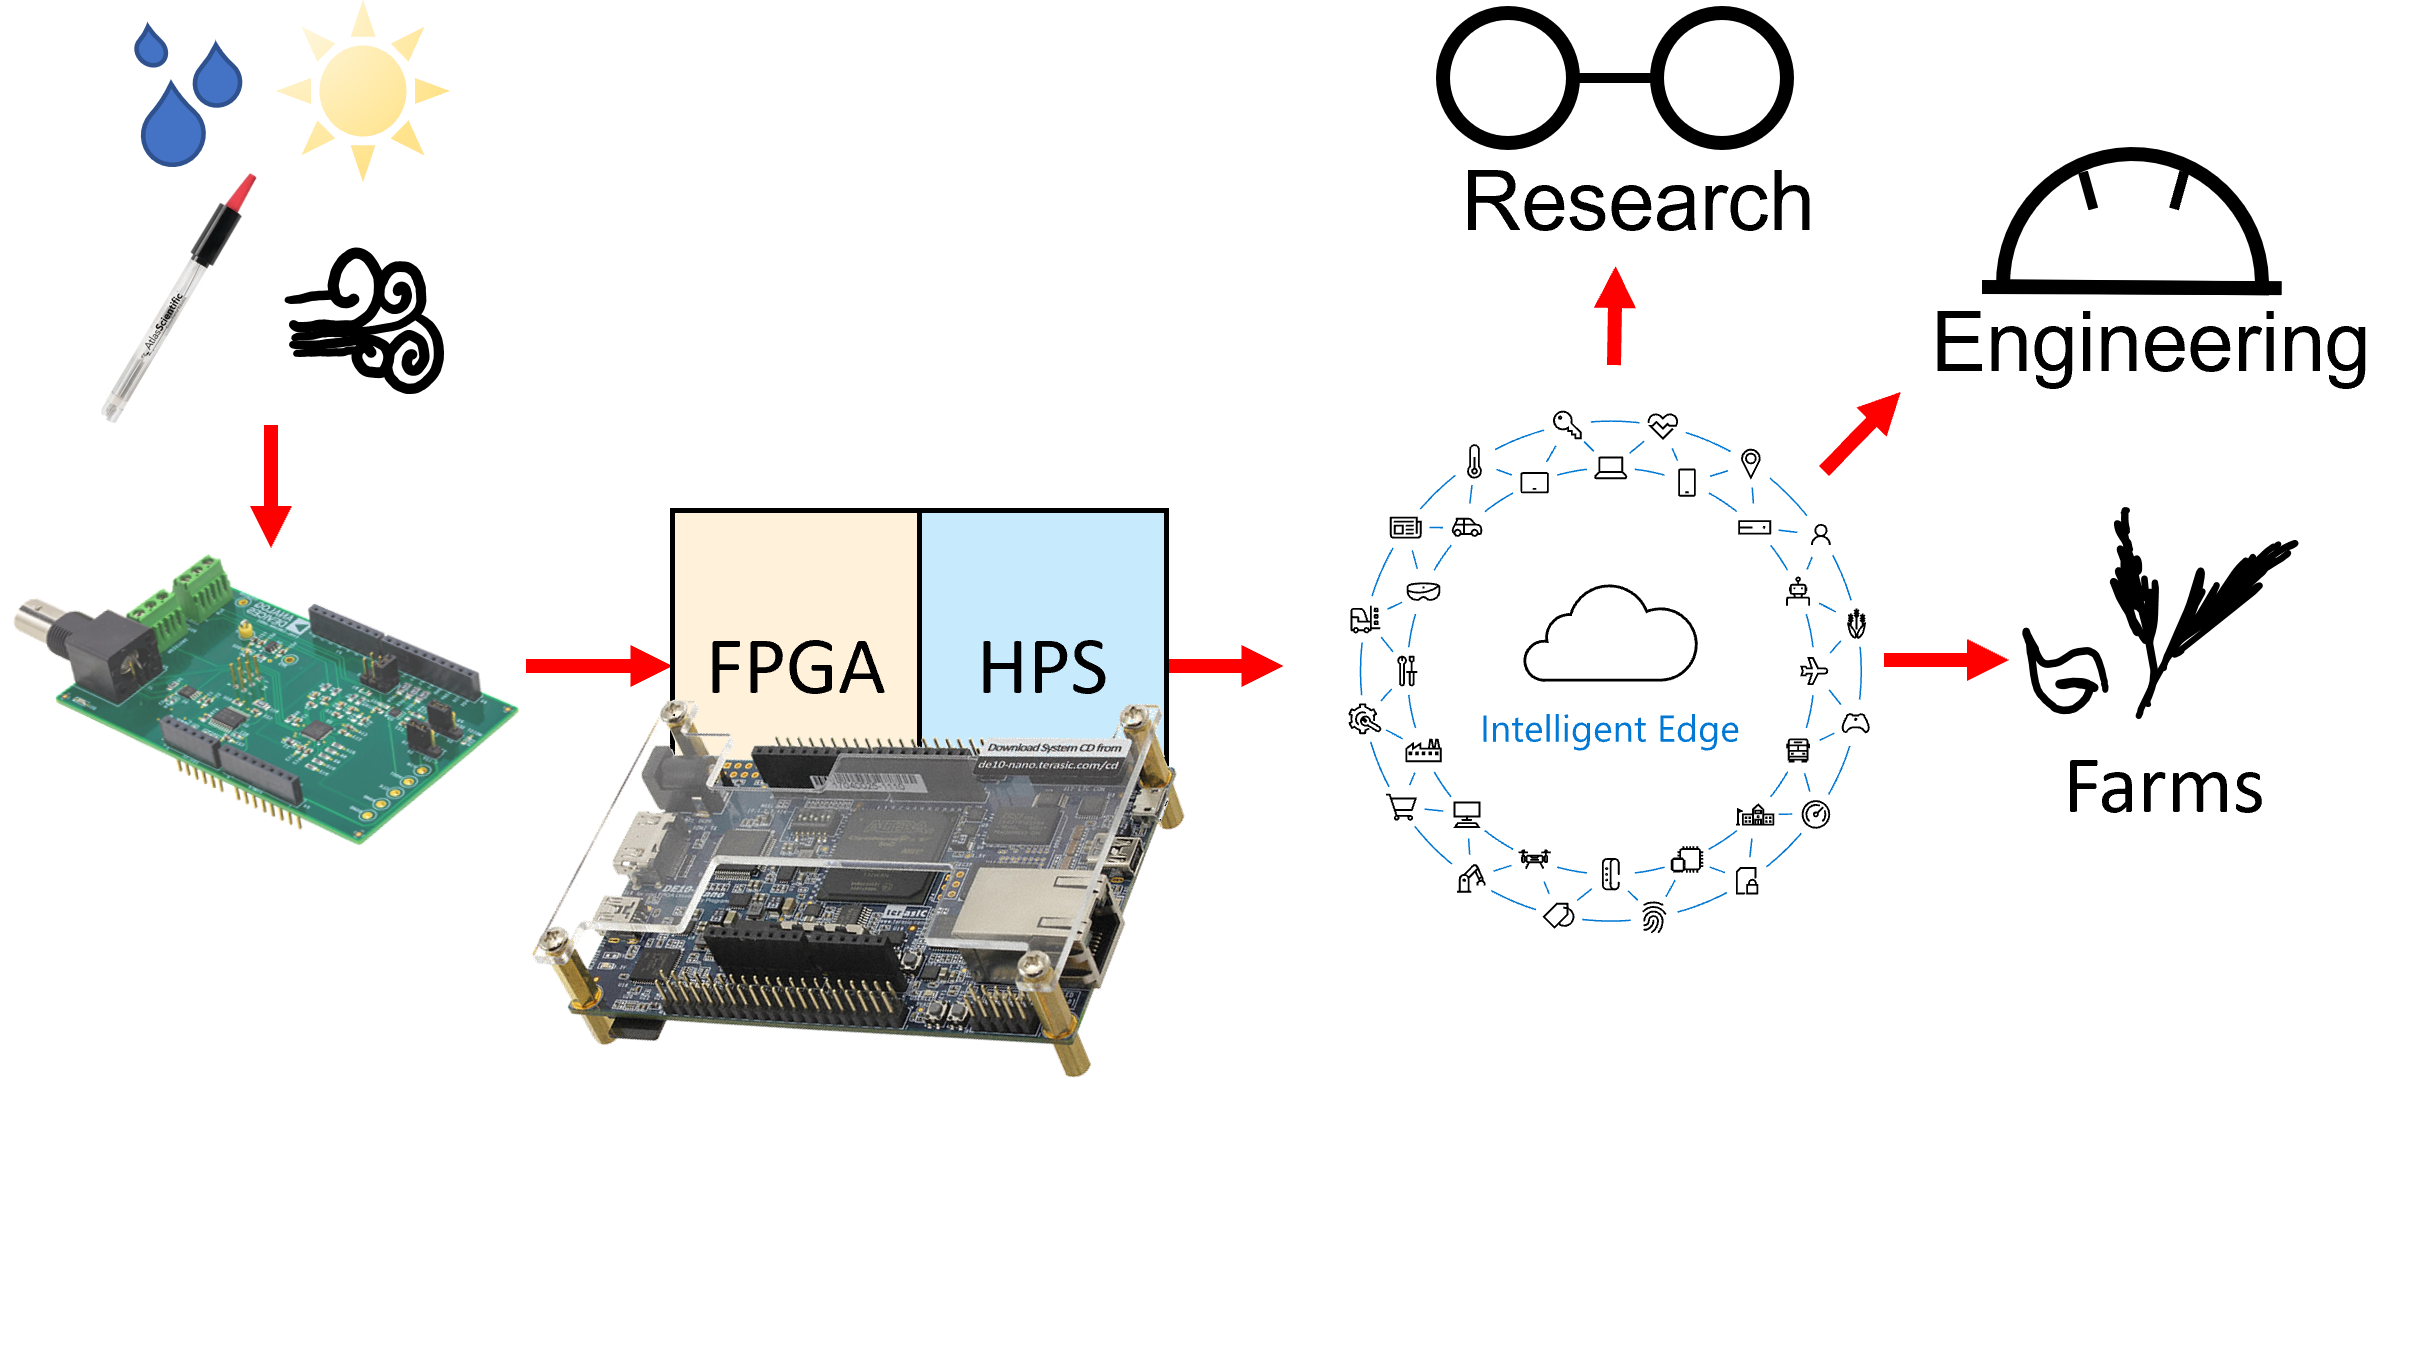
2. Block Diagram
The station would use the FPGA to control the data acquisition and flow while the HPS monitors and interfaces the data with cloud services. The signal conditioners reduce the acquisition challenges for the pH, conductivity, relative humidity, light intensity, etc. From the sensors, the cloud services allow the storage, interpretation and provides Machine Learning tools to improve the information meaning.
According to Azure page, we need an equilibrium between the cost and the data acquisitions. The pay-by-use philosophy raises a though about how many data is needed and its cost. In addition, the communication arbitration is implemented in the system too. This means that a periodic data acquisition is needed for the estimated cost for data storing, analysis, processing, and presentation. The data should be accessible, consequently, the service availability is other parameter to take because the cost is dependent of SLA.
The main board consist of DE10 Nano board with analog devices signal conditioning boards. The SoC Board will have an Operative system to monitor the data locally and do some activities as sensor calibration, I/O operations for possible equipment control. The signal conditioners brings the environment quantities as pH in the water, the light intensity for natural light influence in each band, relative humidity to evaluate if the pollen has the contions for propagation and so on. In addition to, the communications are needed for the cloud connections, consequently, the main board goint to control the data sharing to the Azure services. Azure services allow the data management from the storing and analysis to presentation. Azure IoT hub allows connect our devices to cloud and share data. Furthermore, Azure has Machine Learning Studio to aided model generation from the data acquired or only use a web app for data presentation.
3. Expected sustainability results, projected resource savings
In one hand the solutions available in the region are empirical knowledge. Some data are private and an engineer is needed for interpretability. In the other hand, the FPGA data acquisition handling does not compromises HPS processing time, this allows to HPS process data and comunications with the high abstraction work as Cloud service connection and user interfaces.
Based on the hydroponic features and systems infrastructure, the next points want to be reached
- Reduce crop weather dependency
- Improve product quality
- Increase plants per meter of field
- Create a data sharing infrastructure for analysis and maintenance
- Reduce corrective actions time response in the crop
- Avoid soil damage by harvest production
4. Design Introduction
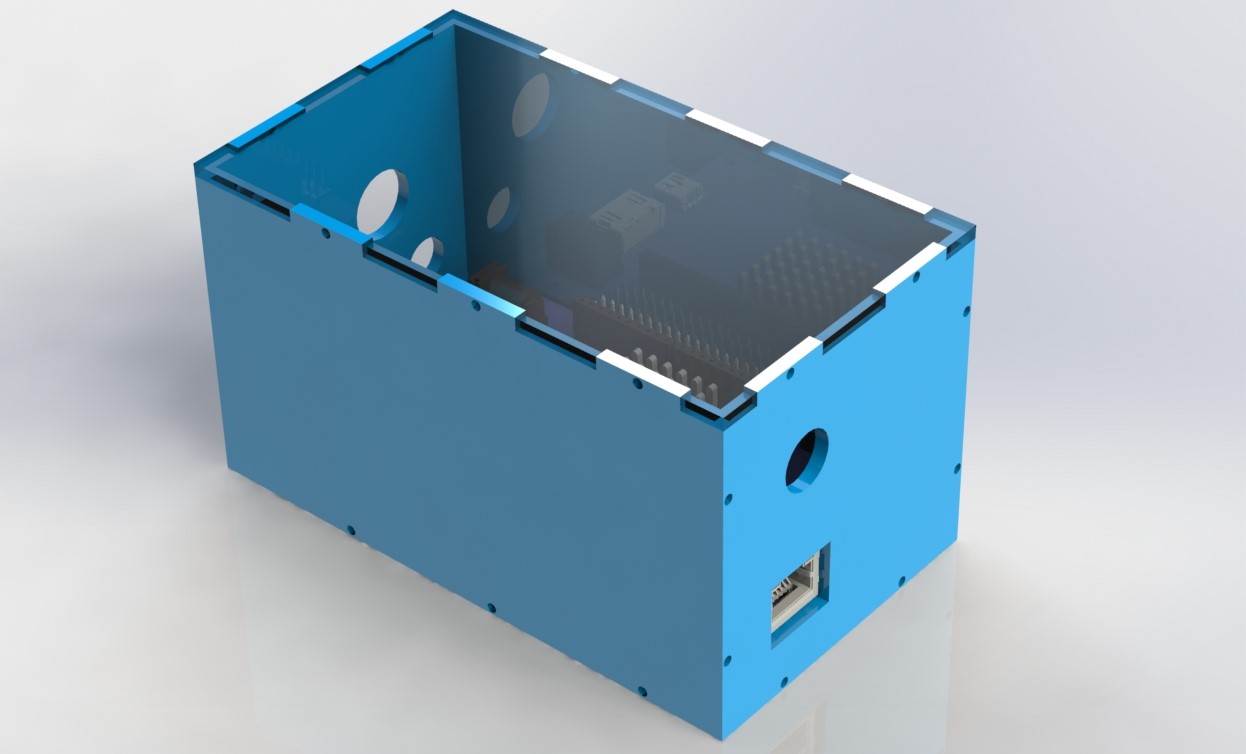
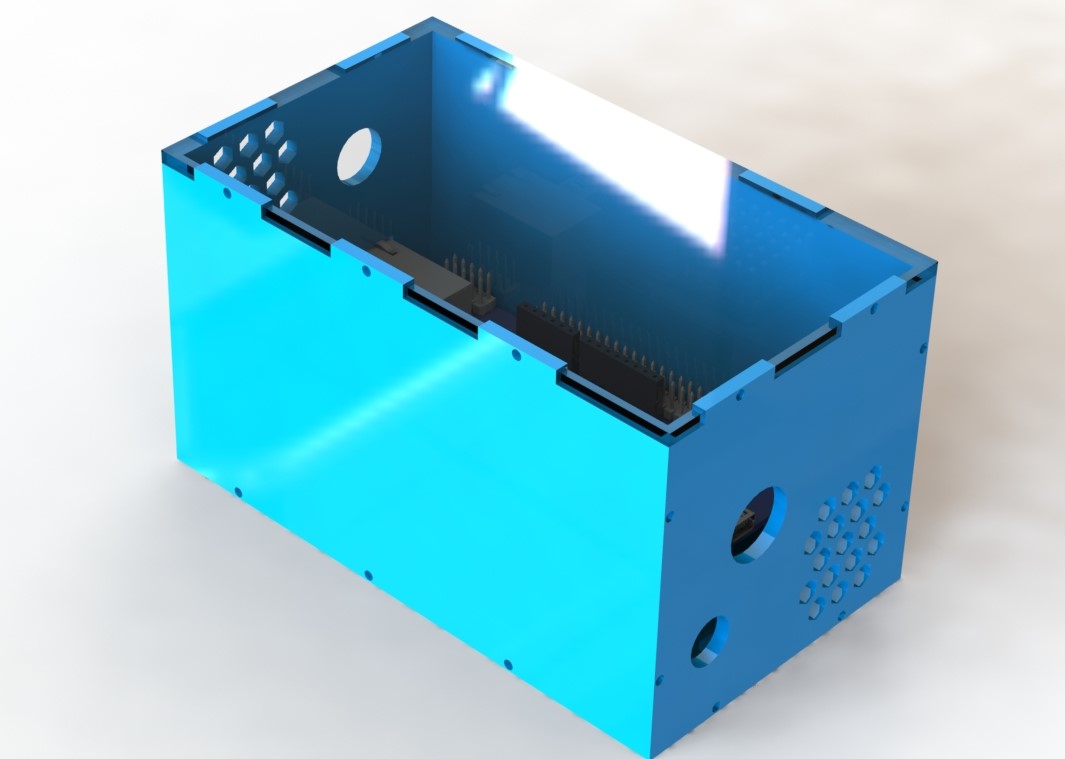
The cloud brings a lot of simplifications to the solution infrastructure. The heaviest task in the IoT is information handling. We could have about 100 nodes and the servers must be able to share information between all. The IoT solution could include servers, networks, web applications, hardware, and more. A node consists of a DE10-Nano board with analog coprocessors for this solution. In addition, the communications could be wired or Wireless, but at the moment of this redaction, the support is for wired communication. To accomplish the node concept, a special case was designed for assembly purposes and is shown below. Special thanks to collingall in Thingiverse for model development, He uploaded a model very approximated with Terasic drawings.
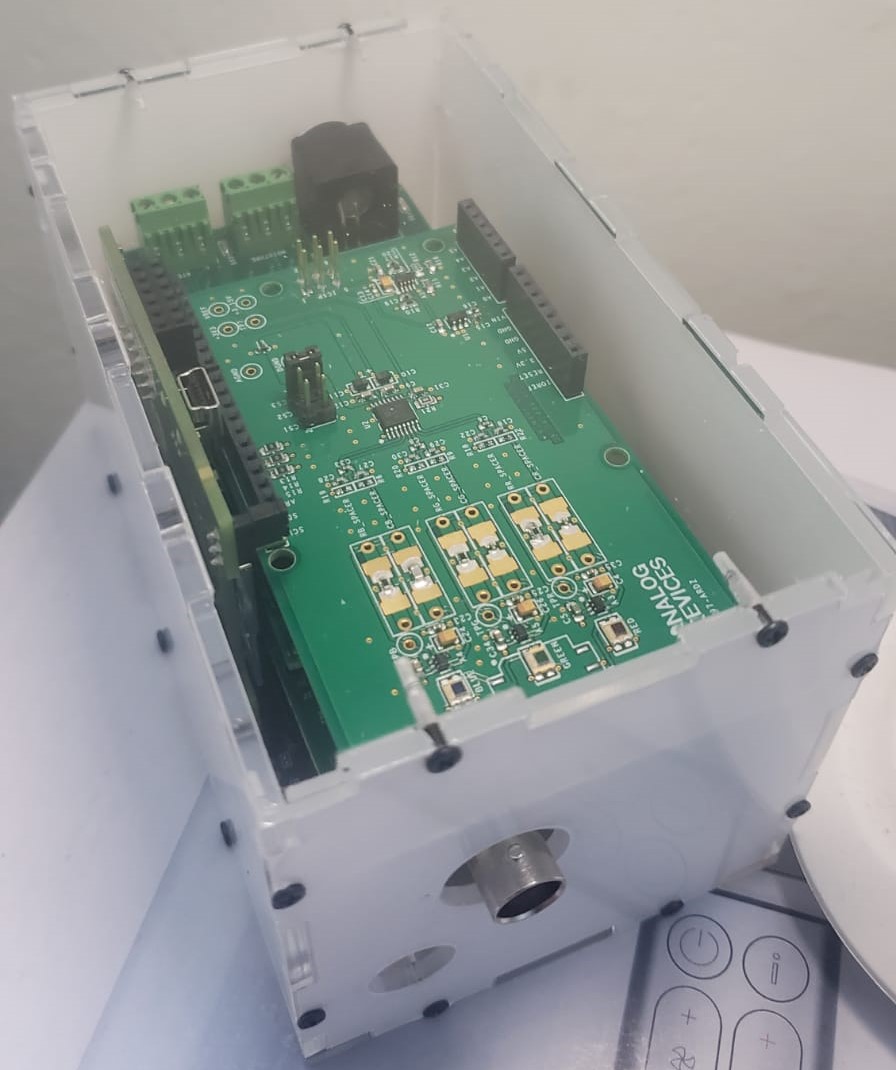
The module has a DE10 Nano board as the core system. The coprocessors are the EVAL-CN0398-ARDZ, EVAL-CN0411-ARDZ, and EVAL-CN0397-ARDZ. Those boards consist of signal conditioners and communication. This approach allows a stackable module for those features that are important in the plant environment. Now, this module accepts the connection of pH and conductivity sensors. In addition, there is a measurement of each of the RGB light bands. The physical module looks like the image below.
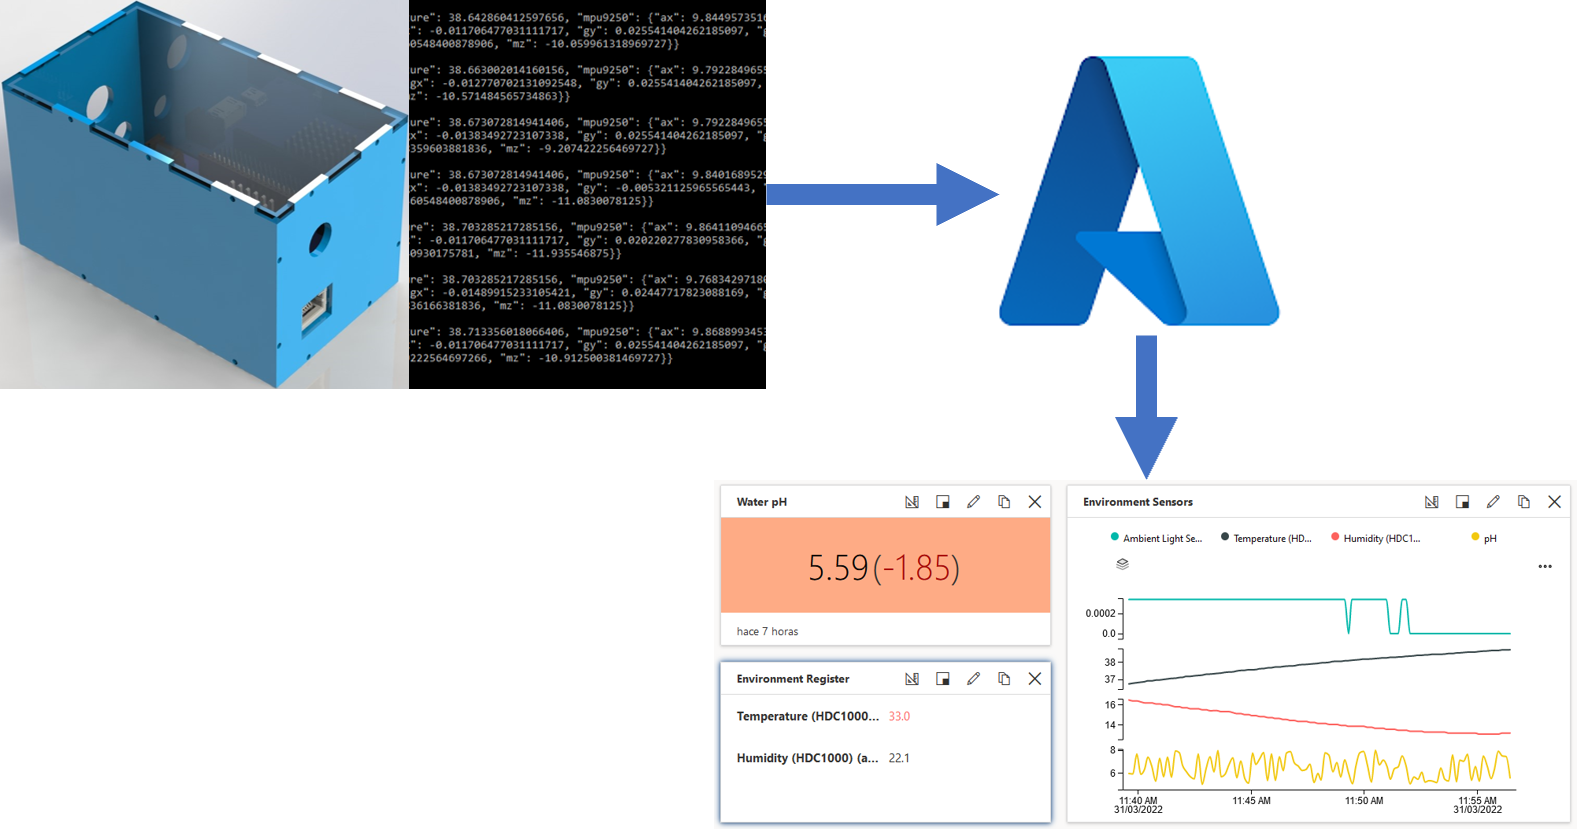
The infrastructure is based on the Azure IoT Central. The base generation was for the RPM template from Terasic GitHub. Only a small modification was required for the full implementation without errors. In addition, the infrastructure was implemented in Central US because the solution should be near to the region of use, Mexico in this case.
IoT Central has a lot of benefits compared with IoT Hub. IoT Central, in addition to device administration, allows data management and User Interfaces. This avoids the instantiation of WebApp services and only uses RBAC for multiple kinds of users without substantial modifications to the solution.
5. Functional description and implementation
The data involved is pH, conductivity, and light with a future adaptation of the module. The deployment has the following form with the stackable modules available,
The module acquires information from the BNC connectors for pH and Conductivity. In addition, there are three sensors for the RGB light band measurement. All the board was encapsulated on a case with only the connections for power and ethernet. In this case, the video output is canceled, and all the communication is by the network. The SSH service allows the starting, updating, and stopping the IoT data sharing.
The IoT Central achieves a complete infrastructure solution for IoT projects. It brings device administration, User interface, and complete solution customization. The User interface allows the RBAC approach for information handling. According to the assigned role, a user can create new apps, panels, and app configurations. An App Operator role performs tasks on data showing, consulting, and personalization. An example is using a color palette for pH illustration. The color indicates if a substance is acid or not like the chemical analysis. This approach brings a known visualization for those users who are chemists. On the other hand, field engineers infer if the actual pH means a risk for plant health.
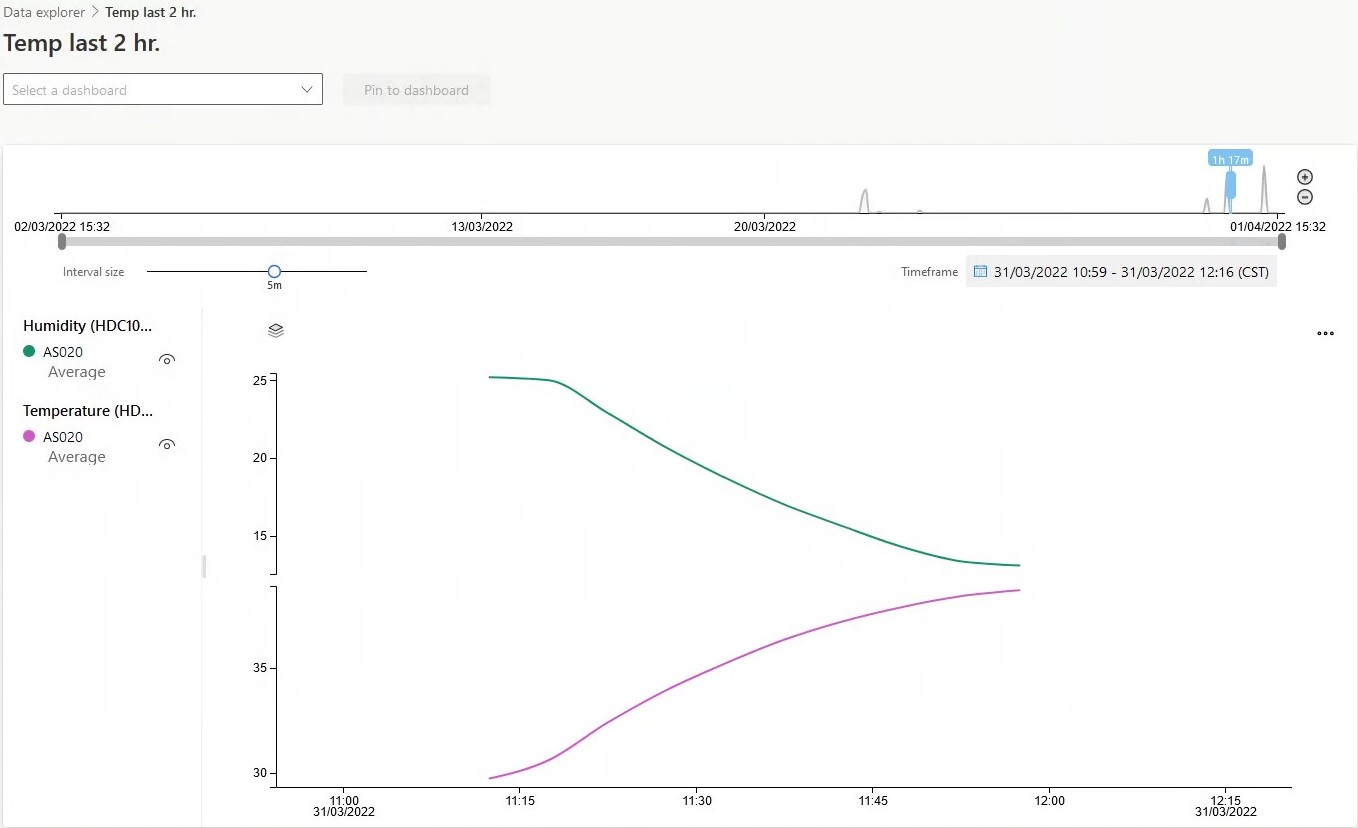
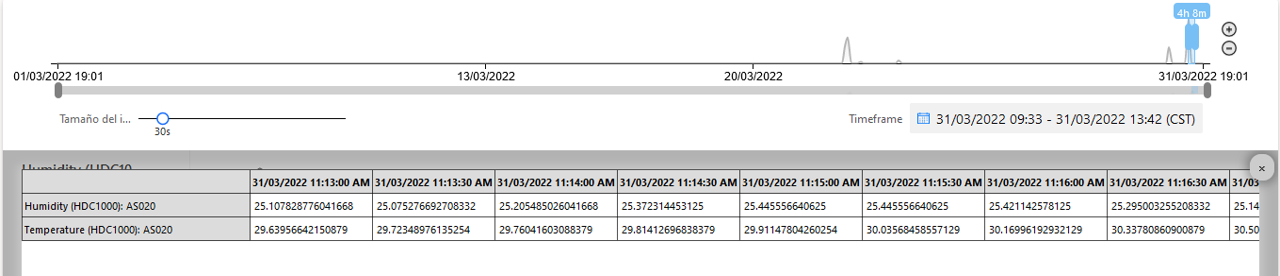
The access to telemetry is fully accessible and can be filtered to get only what is relevant. The preconfigured panel shows a general visualization of the application and information. But each user can create their panels to visualize comfortably.
6. Performance metrics, performance to expectation
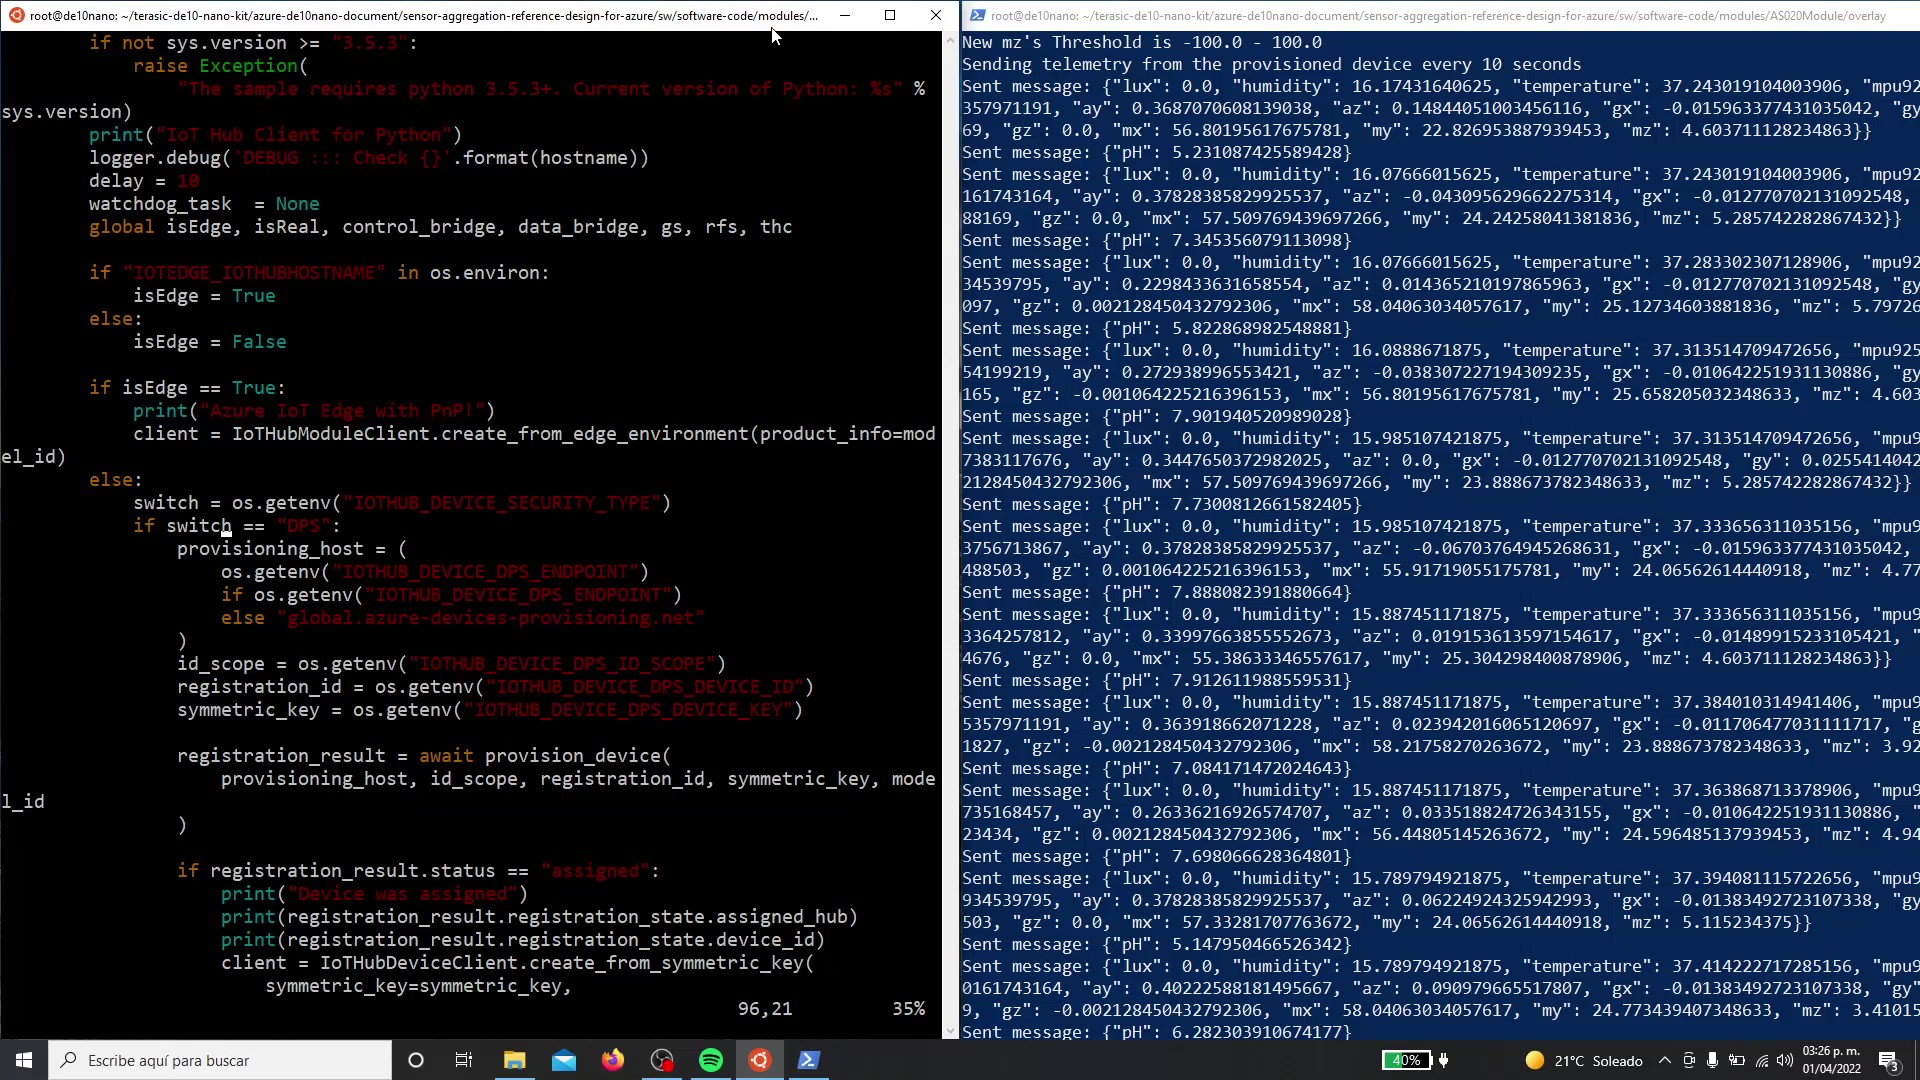
Despite the Azure Sphere availability, the DE10 Nano board is certified for use with Azure IoT services. In addition, the DE10 nano with its analog coprocessors from Analog Devices is very flexible in the design of a module. The software is implemented very quickly using python as an interface between the module and the cloud. The use of this language improves the time to market in addition to a high abstraction level
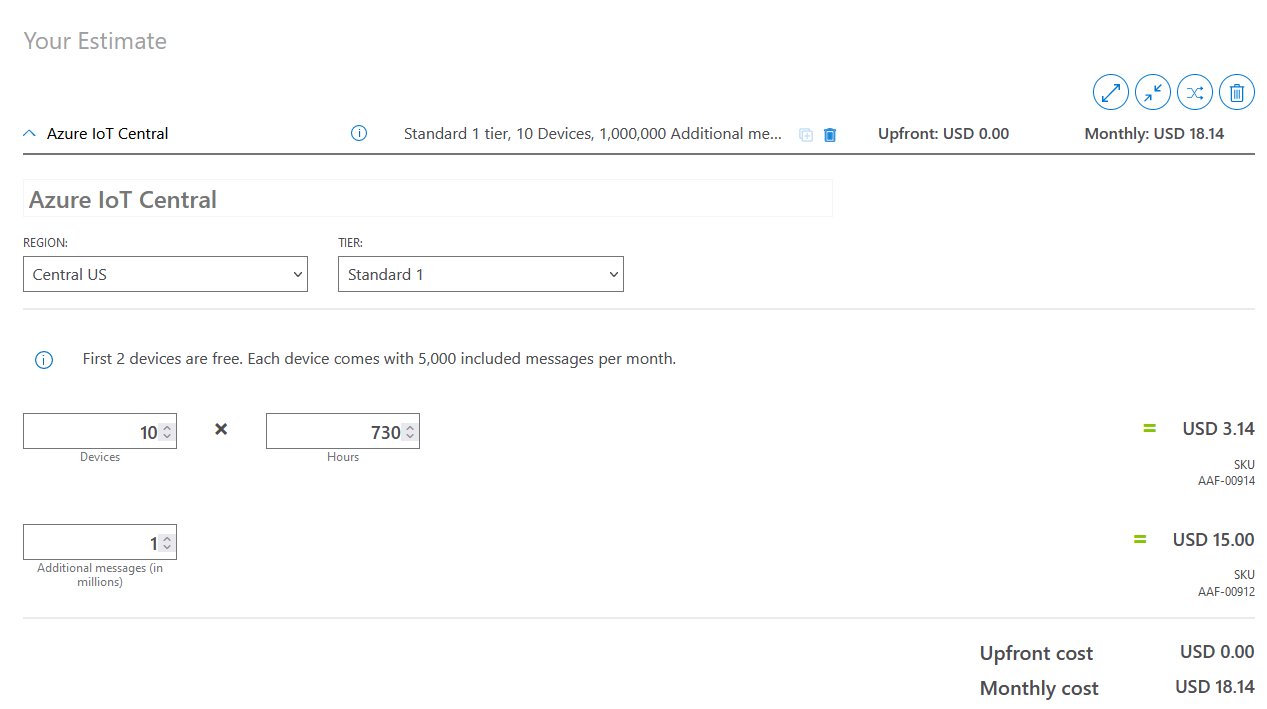
The IoT solution cost can be quickly estimated. Consider a transmission of data every 15 minutes. Each transmission, according to the application, consists of 3 messages; the final count for each device is 730hr*4 transmissions*3 messages = 8760 messages needed for telemetry.
Another option is to use IoT Hub with App service, but the cost could be increased according to the SLA in the application. The modules can be configured as needed and the constructed case can contain all the hardware without the risk of board damage. The top case must be clear because the RGB sensor must be able to measure light sources. The RBAC engine allows the access control of the integrated applications in the organization, from new app creation to only data requests.
The Cloud solution removes the requirement for On-Premises computing resources. This means that Capital Expenditures are not needed for the IoT implementation. The nodes and the IoT Central application are the base of the solution in addition to communication costs.
7. Sustainability results, resource savings achieved
The system does not require special substances to measure the environmental parameters. The substances used for calibration are based on organic salts and could be discarded with the tap water in the environment without, or with minimal, risks. The absence of additional computers in the processing chain brings a better use of energy and mobility because only the mobile application is used for app management and data access by the IoT panels and data queries.
This approach allows a low or null paper required to report, analyze, and store the information acquired along the time. If a user is new in cloud ambients, the data can be exported as CSV format to process in Excel or viewed as a table to get more sense of the behavior of a variable
The main challenges in agriculture involve water management, evapotranspiration, production, etc. To solve them and trace the results data is required to analyze and take action. The data acquisition presents a lot of ways to mage it, from field sampling for laboratory analysis to remote sensing.
Laboratory analysis achieves precise measurements from field parameters like macro- and micro-nutrient estimation, soil structure, water quality, and so on. Unfortunately, the sampling chain has a lot of human error sources, and the chemical analysis produces hazardous waste, consequently, this means an environmental risk if that is not correctly processed. On the other hand, remote sensing brings abstract information. For example, the nutrient concentration is not observable, but we obtain another kind of information like pH or conductivity. Despite the fine-grained data is not available it is possible to correct the field features according to methodologies and parameter restrictions for specific crops.
Hydroponics brings benefits compared with conventional soil production. It has a balance between water, air, and nutrients, this provides good health for the plants from the root development. The water saturation in roots can be controlled but it is required to know if the water has the quality required. Water conductivity provides the salt concentration, related to nutrients, while the pH indicates the acid level in the solutions has contact with the roots. There is a control in substrate humidity. Compared with soil, humidity has better control and quick correction. Moreover, the drain allows these features in addition to adequate air presence in the roots, consequently, the crop performance is improved.
Plant population density can be increased in hydroponic infrastructure compared with the classical soil approach. Unfortunately, the light has a low presence in some plants, and this could be a parameter to consider. The nutrient assimilation is pH-dependent, consequently, the crop performance is impacted. pH has a correction challenge in soil, it is more expensive and requires more time to achieve.
There are some comparatives in books like the following, from an old reference, which shows the soil and hydroponics performance for different plants.
| Plants |
Soil Performance Ton/Ha/harvest |
Hydroponic Performance Ton/Ha/harvest |
|---|---|---|
| Tomato | 30-40 | 100-200 |
| Cucumber | 10-30 | 100-200 |
| Carrot | 15-20 | 55-75 |
| Beet | 56 | 105 |
| Potato | 20-40 | 120 |
| Chile | 20-30 | 60-80 |
| Tobacco | 1.5-2.0 | 4-7 |
To reach the best performance in harvest, it is required continuous observation, parameter correction, and traceability for future crops. In this work, the data is the main value. Data management requires a robust and well-defined infrastructure. The Cloud minimizes the required elements in the data acquisition and processing chain. Each node has only one task at this moment, acquire data.
The embedded systems and particularly FPGA-based systems evolved over the years. The requiring less power and increasing the flexibility of a system. This allows a hardware-software coprocessing that reduces the complexity of development. Along the system does not require more devices the software could be updated to obtain the desired functionality. On the other hand, if there are function accelerate needs, co-process data, or increase the number of supported devices, the hardware can be reconfigurated.
8. Conclusion
A certified product for use in Azure Cloud brings a world of possibilities. This approach allows a full configuration in a known form factor for prototyping and development of a new line of products for precision agriculture. The hardware reconfiguration allows the coprocessing of data and phenomena, from communications in the digital reconfigurations to signal conditioning in a hardware stackable conditioning.
The user interfaces are centralized, and no prior knowledge of web design is required. The user uses drag and drop tools to perform visualizations of data according to he/she needs and this feature brings a comfortable use of the applications. Implementing a new data-sharing design only requires a small knowledge and perspective of how to achieve the correct codification for each new variable.
The visualization of a variable can be customized for each standard of field of study. Like the pH measure, the text and background could represent a color for each pH quantification level to illustrate if a substance, like the water with the nutrient solution, is in the optimal range.
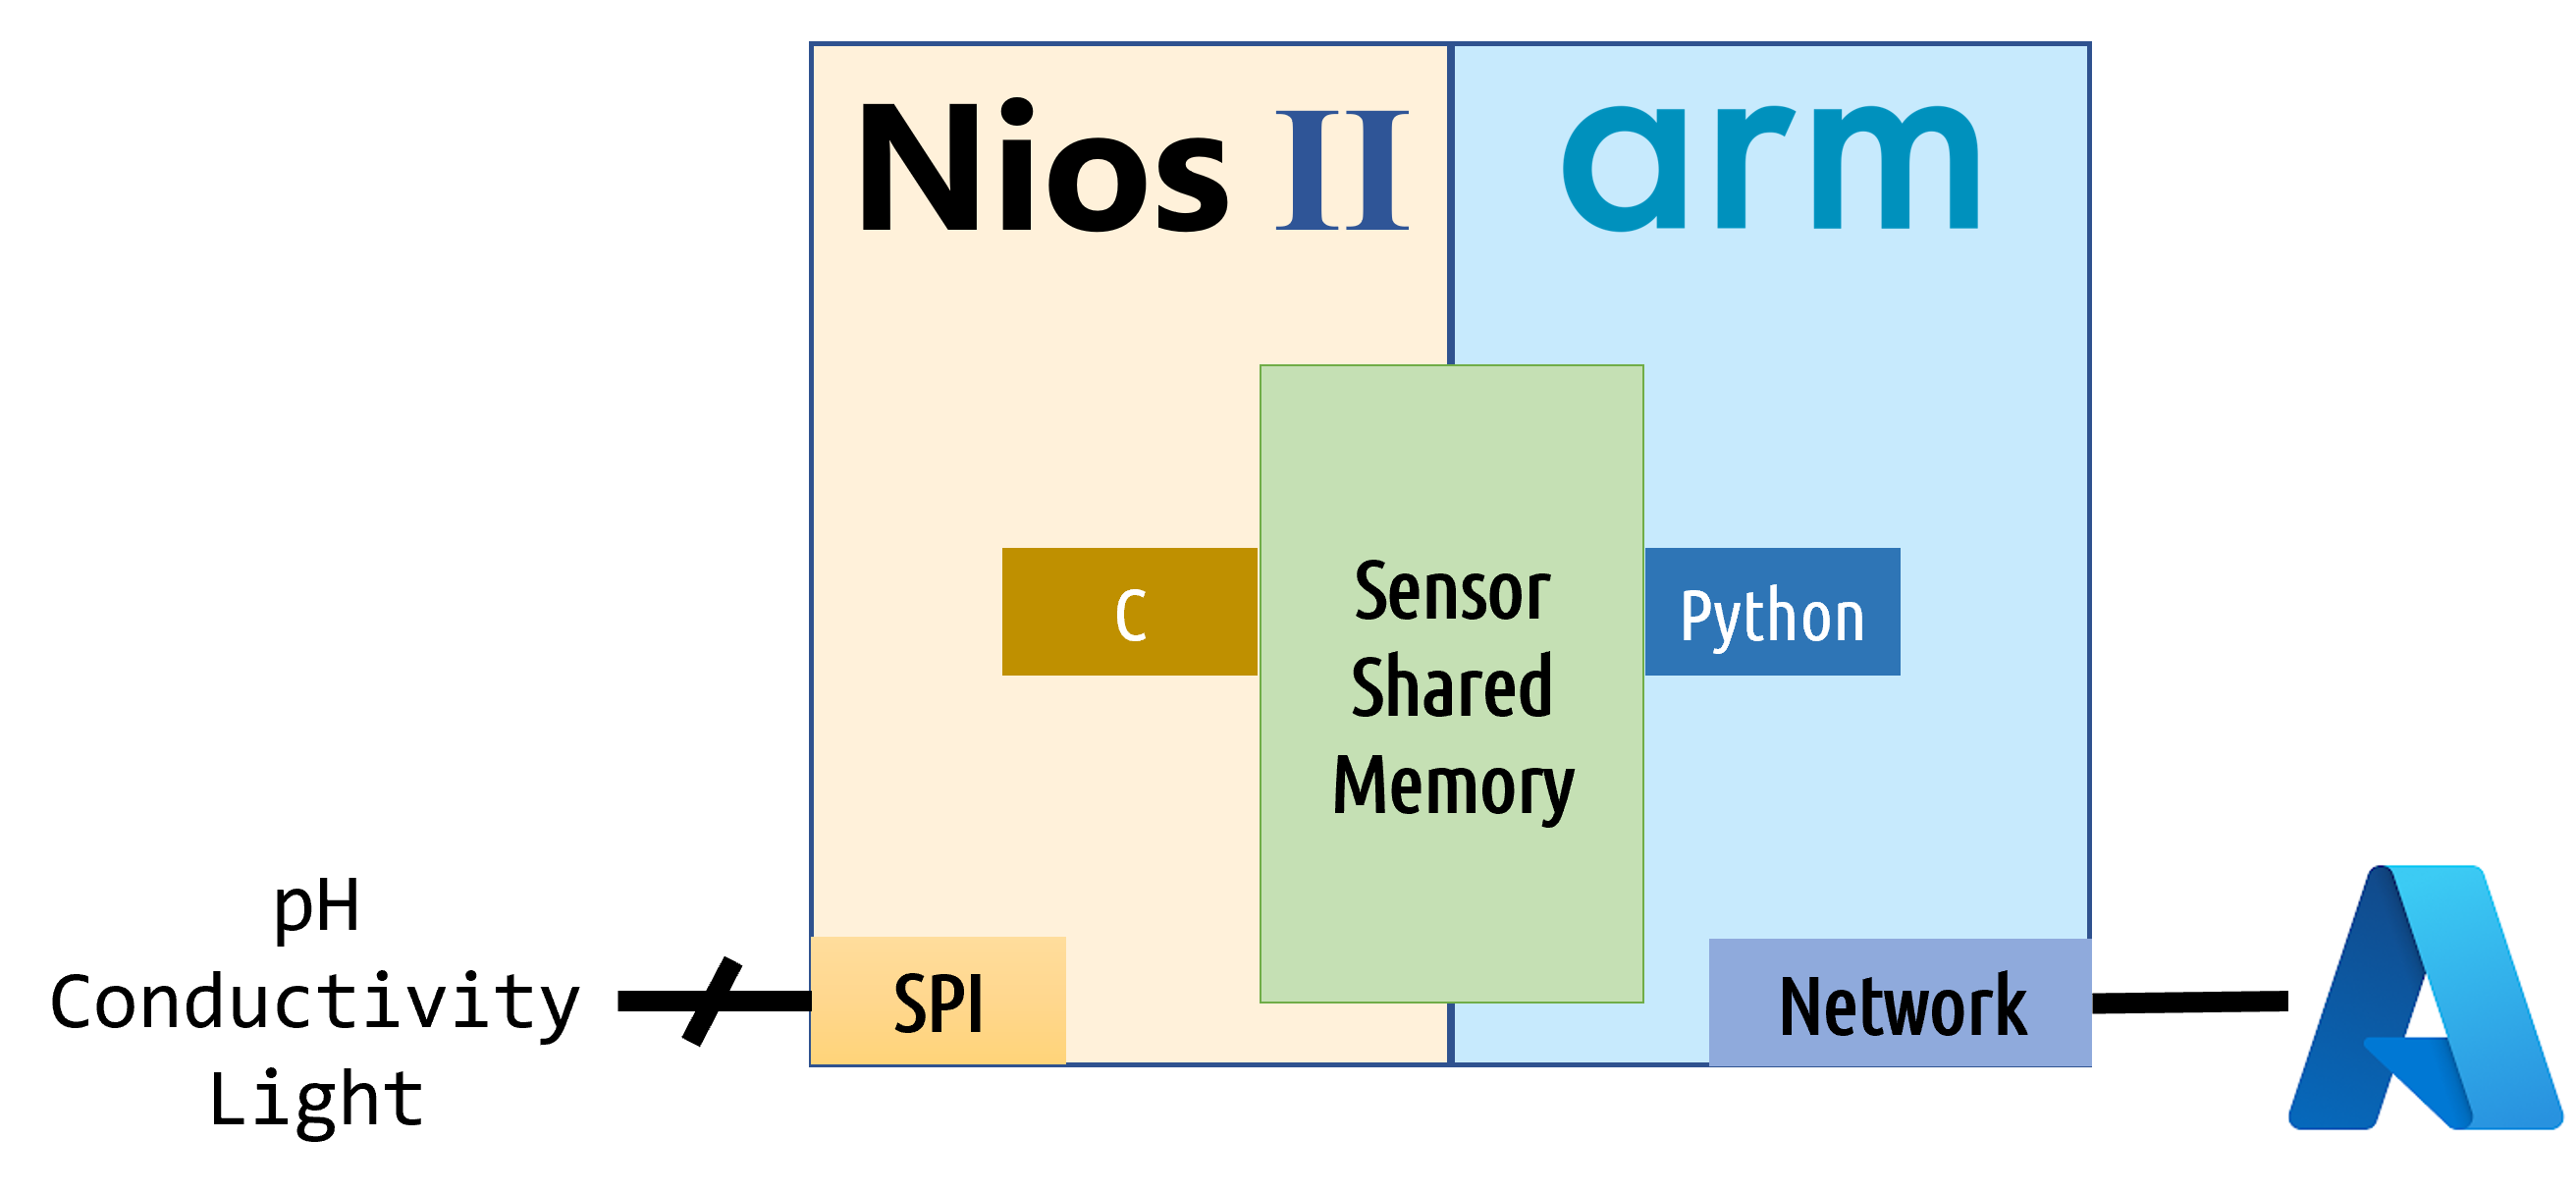
The continuous reconfigurable systems optimization allows efficient implementations. This means a complete module that consumes less energy and defined task execution with minimal stuck risk because Nios acquire data and ARM HPS executes the cloud connection and data sharing.
In the future, the case must be updated because the SoC dissipates a considerable amount of temperature, and the case is closed. The case could include slots, may a fan too, to allow airflow and avoid over-temperature conditions for long periods.
2 Comments
Please login to post a comment.
keith woollvin
I really enjoyed your project, you seem to have been able to achieve a lot with the contest platform in a short time. It would be good to know more about your sustainability goal. Is this a known and quantified problem today? Can you show that your solution can make a significant improvement?