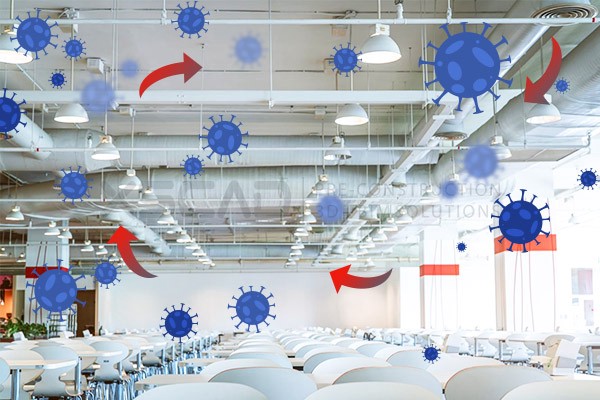
CO2 gas sensors are rapidly gaining interest as a low-cost tool, not only for monitoring air quality inside buildings but also to assess the risk of infection by airborne diseases such as COVID-19.
We will develop a prototype system using the DE10-Nano development kit that will be based on a custom RISC-V microcontroller for the processing of the signals coming from the CO2 sensor. The system will be able to measure the CO2 concentration in the range of 400-5000 ppm.
Demo Video
Project Proposal
1. High-level project introduction and performance expectation
The COVID19 pandemic is rapidly creating growth opportunities for CO2 sensors since there has been an accumulation of research works pointing towards the airborne transmission via aerosols as the major cause of infection [1] [2], and that transmission is more likely to happen in indoor environments. Subsequently, active ventilation in closed spaces like buildings is key to decrease the risk of infection [3] [4]. Moreover, it is also well known that either intermittent or long-term exposure to elevated CO2 concentrations in poorly ventilated spaces (5000 ppm and below) can lead to a variety of health problems and cognitive impairment [5].
Since CO2 is exhaled together with aerosols by the occupants inside buildings, CO2 concentration measurements have been identified as the best available low-cost tool to assess ventilation and risk of infection for high occupancy spaces. Hence, mass deployment of CO2 sensors would have been required at the beginning of the COVID-19 pandemic.
There are two major types of CO2 gas sensors that dominate the market, namely chemical sensors and non-dispersive infrared (NDIR) sensors, being the latter the more predominant. NDIR sensors use optical techniques that are based on the strong absorption of mid-infrared light by the CO2 around 4.26 µm.
NDIR-based methods are particularly suited for CO2 sensing and facilitate its implementation in very compact devices compared to other techniques. They use a source/detector setup that consists either of a lamp/thermopile detector or a LED/photodetector couple, placed inside a housing internally coated with reflective material along the optical path [6], which effectively increases the interactions between photons and the target gas molecules, improving the sensor sensitivity. Another advantage is that it does not chemically react with the target gas; therefore, no toxic by-products are released when measuring the gas concentration.
A roadblock for mass deployment is the cost, and the required infrastructure, namely the required power supply, communication means, and analysis computing platforms. Our goal is to implement a low-power system that can transmit the measured values to the cloud for later exploitation.
Our strategy will consist in providing edge computing resources close to the sensor, where the FPGA board provided for this year’s contest takes care of all the required data processing. The algorithm takes the signal from the different sensors (gas sensor, temperature) and computes the estimated CO2 concentration periodically. By bringing edge computing capabilities close to the sensor we expect to substantially reduce the energy footprint due to the communications of complex data to the cloud and its processing in remote servers.
The sensor can be used for smart home and building automation applications. By integrating CO2 measurement into these systems, significant amounts of energy can be saved and indoor air quality can be greatly improved, leading to a lower energy bill and a healthier indoor environment.
2. Block Diagram
Figure 1 shows the different components involved in the CO2 measurement process:
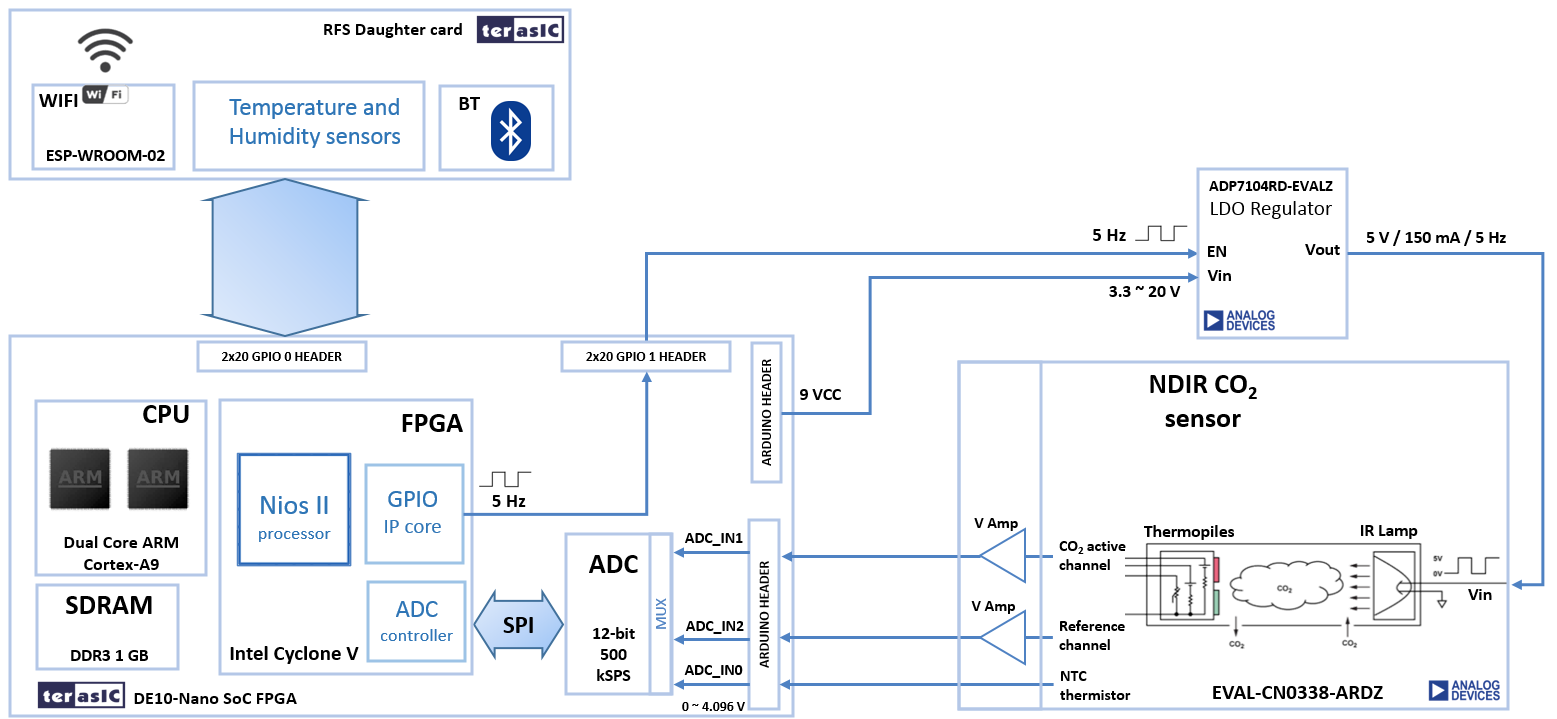
Figure 1. Block diagram of the proposed system
3. Expected sustainability results, projected resource savings
The main goal of this project is to improve people's life by tracking indoor air quality using CO2 levels as the main indicator. The obtained readings can be used by automated demand control ventilation (DCV) systems to keep CO2 levels inside the proper range according to indoor air quality (IAQ) standards and help in the prevention of the transmission of airborne diseases. The system has the potential to improve not only the quality of life for people but also the welfare of animals on factory farms, where CO2 and ammonia (NH3) can reach significantly high levels and put animals at risk [9],[10].
In addition, the system can be easily extended to measure ppm levels of other industrial and environmentally important gases, such as CO, NO2, SO2 or O3, which also absorb light in the infrared spectrum and can therefore be used for outdoor and industrial air quality monitoring applications. It is only necessary to use the appropriate optical filter that matches the absorption spectrum of each gas.
Finally, regarding resource savings, since we bring edge computing capabilities close to the sensor we expect energy savings in two major aspects:
1) Communications, since all the data processing is going to take place on edge and only a single measure is going to be transmitted at specified intervals.
2) Data processing, since specific hardware/software is being deployed near the sensor that allows being more energy-efficient than running the application in a generic remote server.
4. Design Introduction
As already mentioned in the previous section, the purpose of this design is to measure the CO2 levels for monitoring the air quality inside buildings, targeting from large facilities, such as office buildings, to regular homes. Our proposal makes use of a hardware/software co-design approach to optimize the system’s data processing to achieve low energy consumption and reasonable performance.
The block diagram in Figure 1 illustrates the system which includes an NDIR CO2 sensor in a plug-in add-on board provided by Analog Devices (EVAL-CN0338-ARDZ) with a thermopile-based detector, a filament lamp, and a reflective tube. The ADC in the DE10-Nano board quantizes the analog signals from the detector, and the samples are processed with a proprietary Nios II soft processor implemented in the Altera FPGA.
Other non-proprietary platforms based, for instance, on RISC-V could have been used for the soft processor part but because of the tight schedule, we decided to take advantage of the already mature ecosystem that exists around Intel FPGAs, such as a powerful design software like Quartus Prime and a very well-established soft processor IP like Nios II that comes available with Quartus. All these together made it possible to accelerate the time of prototyping and validation of the system.
5. Functional description and implementation
The working principle of an NDIR sensor lies in the gas absorption law formulated by A. Beer and J. Lambert, which says that the amount of absorbed light with a specific wavelength by a given gas depends on the length of the optical path of the sensor. The Beer-Lambert law is formulated as follows:
I= I0eεcL
where I is the intensity of the incident light, I0 is the intensity of the transmitted light, e is the wavelength-dependent absorptivity coefficient, c is the gas concentration and L is the length of the optical path. Therefore, the larger the optical path the more interaction we get between the beam light and the gas molecules, which also results in a better sensitivity of the sensor.
The picture in Figure 2 is an example of a non-dispersive infrared gas sensor. It has a broadband infrared source on one end and two detectors with their associated filters on the other end.
The filters cover neighbouring absorbing bands with one of them covering the absorption band of the target gas, CO2 in this case, and the other one, which is associated with the reference detector, covers a non-absorbing band.
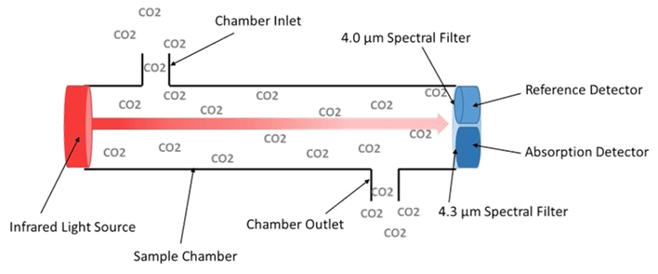
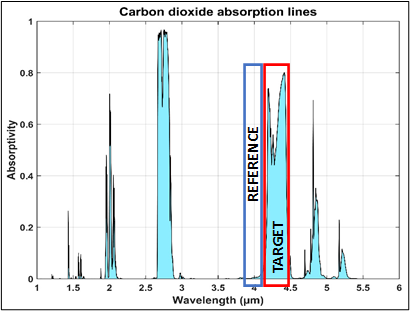
Figure 2. Non-dispersive infrared spectroscopy technique
The IR light from the source is usually chopped (mechanically) or modulated so that the thermal background signals can be offset from the desired signal. For that reason, a 5 Hz square signal is used to switch on and off the voltage regulator that drives the lamp as shown in the system’s block diagram in Figure 1. A simple square wave generator is implemented using a single-ended GPIO block with a 1-bit register that flips values periodically.
According to the circuit note of the EVAL-CN0338-ARDZ plug-in board, the maximum chopping frequency is 5 Hz [7]. Such a low frequency is because the bandwidth of the whole signal chain (linear regulator, lamp, thermopile, and thermopile driver) in this type of application is commonly less than 10 Hz [8].
On the sensor board, the IR light reaches the thermopile detector and heats up the internal thermocouple junctions, which in turn generates a very small thermoelectric voltage. There are 2 thermopiles in the sensor board, one is associated with an optical filter tuned to the absorption band of the CO2 (centred at 4.26 nm), and the other one, called the reference, is associated with another optical filter with a neighbouring non-absorbing band (centred at 3.91 nm). The reference channel is used to monitor the variations in the lamp output due to source aging, power variations, etc. The sensor board also provides an NTC thermistor whose analog output signal is also used in the calculation of the CO2 concentration.
All the mentioned-above signals coming out from the IR sensor board are converted into digital samples by the onboard ADC (Linear Technology LTC2308) and sent to the soft processor, which computes the estimation of the CO2 concentration. For the the algorithm to work, it requires a two-point calibration procedure described in the application note [7] from Analog Devices. This calibration is better performed in laboratory conditions with known concentrations of CO2. However, a gas laboratory was not available for our purposes and we proceeded to use a much simpler procedure where the two-point CO2 calibration were taken as follows:
xLOW: low concentration CO2 gas (or 0% vol.) = 0 ppm
xCAL: known concentration CO2 gas = 400 ppm, approximately the concentration in outdoor fresh air
According to [7], we used the modified Beer-Lambert equation which quantifies the fractional absortion (F.A.) of light as a function of the gas concentration x as follows:
F.A.=SPAN (1-e-b(x^c))
where the SPAN factor is a constant introduced because not all IR radiation that impinges on the thermopile is absorbed by the gas, and the power term c is added to compensate for variations in the optical path and light scattering. The term b is equal to the product between the optical path length and the absorption coeffcient of the specific gas.
Therefore, the gas concentration x can be calculated from the expression:
x = (ln (1 – F.A./SPAN) / (-b))1/c
where the fractional absorbance is estimated from the peak-to-peak voltage signals from the thermopiles shown in Figure 3. The shape of those signals is because of the modulation of the light source at 5 Hz and the expression of F.A. is calculated as follows:
F.A. = 1 – VppACT / (VppREF * ZERO)
ZERO ≈ VppACT(@0 ppm) / VppREF(@0 ppm)
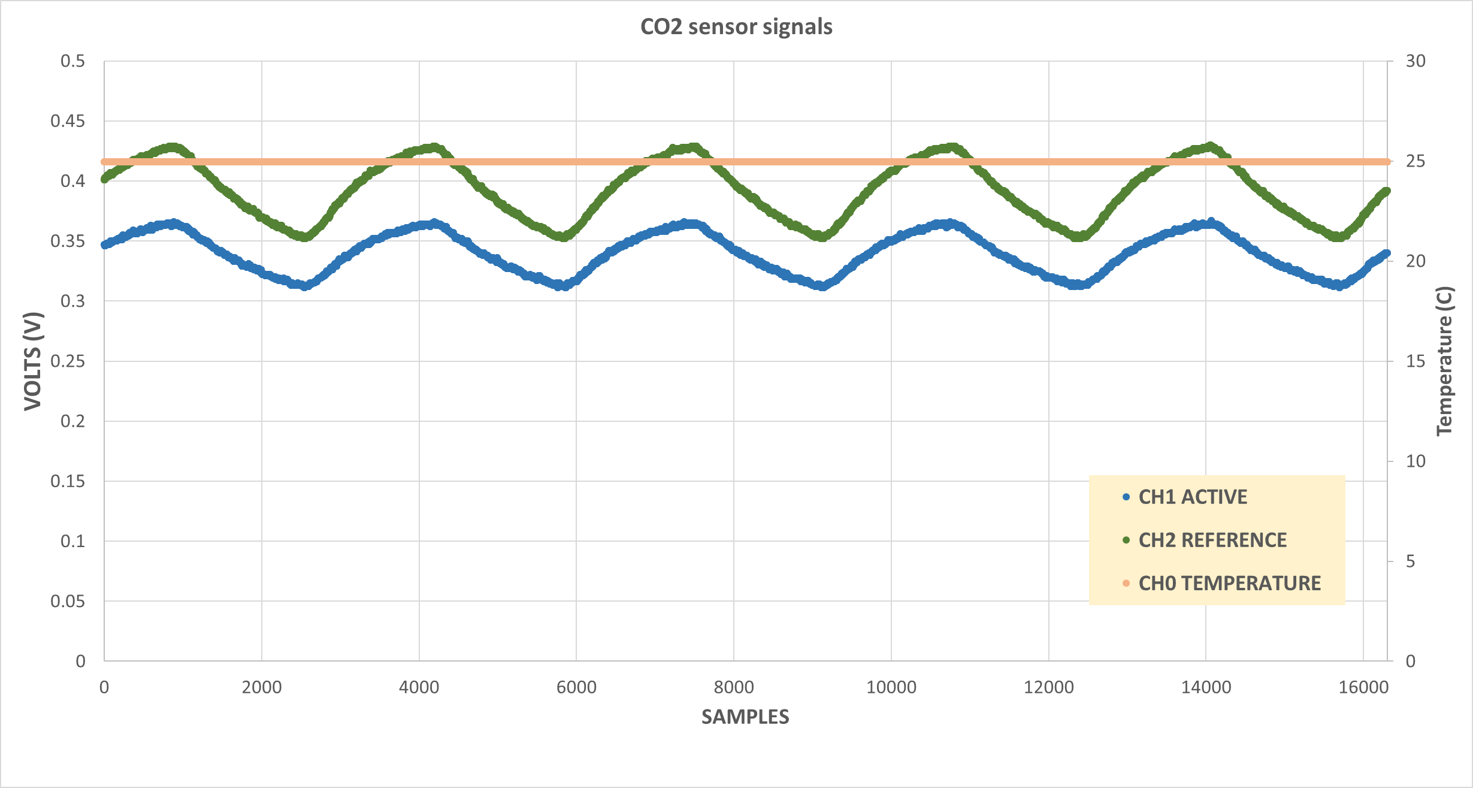
Figure 3. One second of thermopile data samples (active and reference)
In Figure 3 we can see the temperature-dependent voltages generated in the thermocouples by modulating the light source at 5 Hz. In general, the CO2 readings show relatively large variations between consecutive readings, so we apply a moving average filter running in the the Nios II processor to offset this noise.
Finally, the obtained measure is written in the Avalon shared memory (see reference design in Figure 5) available in the DE-10 Nano board where it is accessible to the ARM cores on the HPS side. A specific application is used to send the data periodically to the Microsoft Azure servers using the DE10-Nano communication resources.
6. Performance metrics, performance to expectation
The obtained measures are quite noisy due to the temperature-dependent nature of the thermopile detector which clearly affects the accuracy of the readings. Although this was expected, in the set of measures shown in Figure 4 we see how consecutive measurements (red dots) within a few seconds can differ substantially in more than one hundred ppm. Therefore, a moving average is required to smooth the curve (blue dots) and produce better quality data that can be later used, for instance, by a higher-level control system that monitors and keeps the CO2 concentration in the room inside a predefined range. As a matter of fact, in the below picture, subsets of 16 samples are used for the filter.
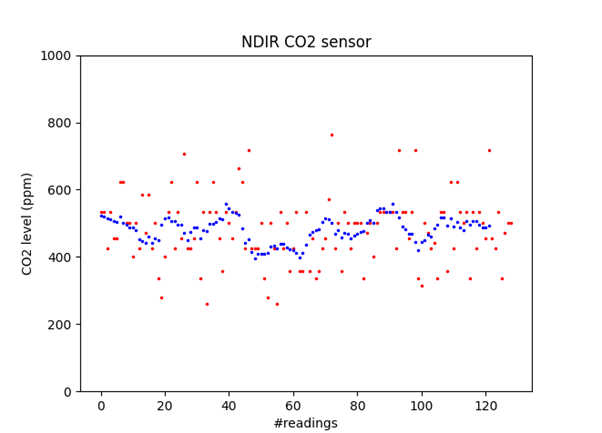
Figure 4. A set of 128 CO2 level measures was obtained during a five-minute interval. In red, the data is without filtering. In blue, a moving average filter is applied.
Because of this temperature dependence, one of the drawbacks of using this type of sensor is that a stabilization time of a few minutes is recommended before starting the measurements. On the other hand, this limitation has also an impact on the overall energy spent by the system to obtain the readings because of the power consumption of the filament lamp. Probably, other types of NDIR sensors are more suitable for an ultra-low-power system that could be fed by a battery, for instance, those based on an IR LED and a photodiode as a source-detector couple. The latter would allow to completely switch off the system when not in use and no temperature stabilization time would be needed. Moreover, higher frequencies could be used to modulate the light source because of the much faster response of photodiodes compared to thermopiles. Then, by applying proper demodulation techniques to the signal coming out from the detector we can improve noise rejection and obtain better reading accuracy.
Nevertheless, the system responds well to a sudden rise in CO2 levels as shown in Figure 5, where this peak was produced by a single breath exhalation right over the NDIR sensor. As a side note, a breath exhalation contains between 30,000 to 40,000 ppm of CO2. In any case, the reading accuracy of the system needs to be improved with proper calibration of the sensor performed in lab conditions with controlled parameters of temperature and calibrated CO2 concentration. Failing this, as is the case for the present project, we opted for an alternative option that is to calibrate the system considering that the CO2 concentration in outdoor fresh air is approximately 400 ppm.
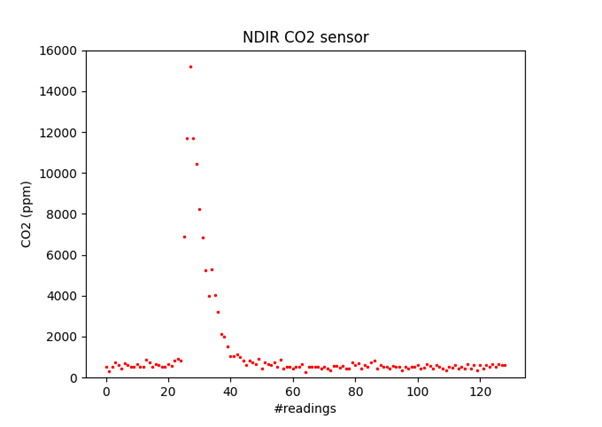
Figure 5. A set of continuous readings showing a sudden rise in CO2 levels produced by a single breath exhalation
On a different note, additional benefits of using the Intel DE-10 Nano FPGA Kit for this work are the availability of a large number of reference designs and the possibility to find an example project with similar requirements which greatly simplifies and reduces the prototyping time, for instance, by reusing the same IP cores or application source code. Figure 6 shows the example project from Intel that has been reused for this work, which reads the signals from various sensors in the RFS board with the help of a Nios II processor through an i2c bus and writes the measurements in the Avalon memory shared with the HPS.
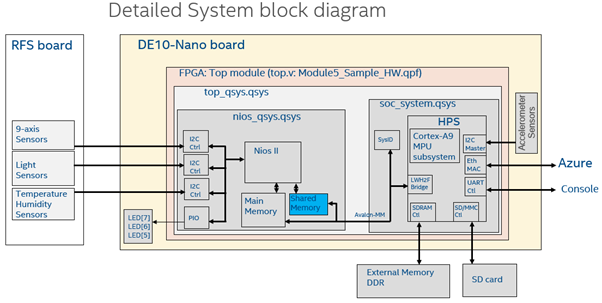
Figure 6. Reference design from Intel that has been reused for this project
7. Sustainability results, resource savings achieved
We can look at the sustainability results from the S.M.A.R.T. metrics perspective considering the following goals: specific, measurable, achievable, realistic and timely.
Specific SMART goals:
We believe that the use of an FPGA in this project is completely justified since we envision not a single-sensor device but a multisensor platform that can be adapted to a variety of sensors and use different protocol communications for its use in air quality monitoring either in buildings, farms or outdoor air quality stations.
Measurable SMART goals:
The system can be integrated into demand-control ventilation (DCV) systems that keep air quality inside acceptable parameters according to commonly accepted standards like the air quality index (AIQ).
Achievable and Timely SMART goals:
This project is a proof of concept that shows how the system can be built with the available technology and software tools provided by InnovateFPGA's partners in a relatively short time. Similarly, it should be possible to deploy a network of gas sensors in a short space of time.
Realistic SMART goals:
In terms of cost, it is clear that single-node sensors that can be found in today's buildings (e.g., smoke detectors, temperature and relative humidity probes, etc.) are comparatively much cheaper than the cost of an FPGA development kit like Intel's DE10-Nano (about 5-6 times), but this aspect is clearly outweighed by the ability to integrate multiple sensors and the processing and communication resources available in the proposed system.
Resource savings:
On the other hand, since we bring edge computing capabilities close to the sensor we have substantially reduced the energy consumption related to the communications since the ADC samples are not sent to a cloud server but all the data processing takes place on edge and only the final CO2 reading is sent at periodical intervals.
8. Conclusion
The goal of the proposed work was to demonstrate that a CO2 meter system could be prototyped and installed in the field in a relatively short time by using a well-established platform such as the Terasic DE10-Nano development kit and the CO2 sensor CN-0338 from Analog devices based on non-dispersive infrared spectroscopy. The system has been successfully tested and the present work demonstrates that the system is easy to deploy and that collected readings can be easily managed in the Azure servers with the provided analytics tools.
The scope of the application not only includes the monitoring of the air quality for the prevention of the transmission of airborne diseases, as mentioned in the introduction, but it can be applied in other fields where CO2 levels play a key role such as industrial or agricultural processes including wine fermentation, fruit ripening or meat processing.
References
[1] Lidia Morawska, Donald K Milton, “It Is Time to Address Airborne Transmission of Coronavirus Disease 2019 (COVID-19)”, Clinical Infectious Diseases, Volume 71, Issue 9, 1 November 2020, Pages 2311–2313. Available: https://doi.org/10.1093/cid/ciaa939
[2] A. A. Rabaan, S. H. Al-Ahmed, M. K. Al-Malkey, R. A. Alsubki, S. Ezzikouri, F. H. Al-Hababi, R. Sah, A. Al Mutair, S. Alhumaid, J. A. Al-Tawfiq et al., “Airborne transmission of SARS-CoV-2 is the dominant route of transmission: droplets and aerosols”. Infez. Med, vol. 29, pp. 10–19, 2021
[3] H. Qian and X. Zheng, “Ventilation control for airborne transmission of human exhaled bio-aerosols in buildings,” Journal of thoracic disease, vol. 10, no. Suppl 19, p. S2295, 2018.
[4] B. J. Bazant MZ, “A guideline to limit indoor airborne transmission of COVID-19 ”. Proceedings of the National Academy of Sciences of the USA, vol. 118, no. 17, pp. 1–12, 2021
[5] Jacobson, T.A., Kler, J.S., Hernke, M.T. et al. “Direct human health risks of increased atmospheric carbon dioxide”. Nat Sustain 2, 691–701 (2019). Available: https://doi.org/10.1038/s41893-019-0323-1
[6] D. Gibson and C. MacGregor, “A novel solid-state non-dispersive infrared CO2 gas sensor compatible with wireless and portable deployment”, Sensors, vol. 13, no. 6, pp. 7079–7103, 2013. [Online]. Available: https://www.mdpi.com/1424-8220/13/6/7079
[7] Analog Devices, Inc. “NDIR thermopile-based gas sensing circuit”, Circuit note CN-0338. Available: https://www.analog.com/media/en/reference-design-documentation/reference-designs/CN0338.pdf
[8] Analog Devices, Inc. “ADI Gas Detector Solution Based on NDIR and PID”, 2012. Available: https://www.analog.com/media/cn/technical-documentation/apm-pdf/adi-gas-detector-solution-based-on-ndir-pid-solutions_en.pdf
[9] Barrasa, M., Lamosa, S., Fernandez, M. D., & Fernandez, E. (2012). Occupational exposure to carbon dioxide, ammonia and hydrogen sulphide on livestock farms in north-west Spain. Annals of Agricultural and Environmental Medicine, 19(1).
[10] Kristensen, H., & Wathes, C. (2000). Ammonia and poultry welfare: A review. World's Poultry Science Journal, 56(3), 235-245. doi:10.1079/WPS20000018
4 Comments
Please login to post a comment.
Reza Khorasani
Congratulations on your achievement. I was wondering if this device can measure the CH4 and CO concentration as well. If so, how can it be set up?
keith woollvin
Congratulations on making it to the Grand Final! Thanks for adding the references, they definitely support the basis for your project - I hope I can meet you and see your project in San Jose