

AS033 » Reconfigurable virtual instrumentation with FPGA
This project presents the development of open source libraries, software tools, and firmware that can emulate the behavior of different conventional laboratory instruments using FPGA boards and a personal computer (PC), thus creating a multiple virtual instrument. The developed system allows the choice of instrument to be used without making a substantial change in the main hardware, the system has been designed in a modular way so that it is easily adaptable and customizable, the PC software and the hardware description language used to code the FPGA are easily extensible to add functionalities or applications.
The development of experimental sciences and engineering benefits from the ability to obtain reliable data from controlled situations and process as measurements and comparisons. The tools that allow us to obtain this information are the instruments.
An equipment that allows a measurement or acquisition of information for a specific experiment or work is a permanent requirement in research laboratories, conventional low-cost tools do not always allow adequate customization, and only the most expensive equipment allow programming, configuration or customization. Therefore often, the researchers of low resource centers do not have adequate tools and are in need of making themselves small application specific electronic systems. Most of the time, the hardware and software development for such kinds of devices are not shared and also not reusable. Virtual instruments are a good alternative because are cheaper than conventional instruments and also more flexible.
With the exponential increment of the complexity of the reconfigurable logic devices, the Field Programmable Gate Array (FPGA) becomes an attractive element for build reconfigurable virtual instruments, because of the inherent flexibility.
The new FPGAs integrates a hard processors system (HPS), and bring to the virtual instruments world the possibility of integrating all the components of the instruments in one compact device.
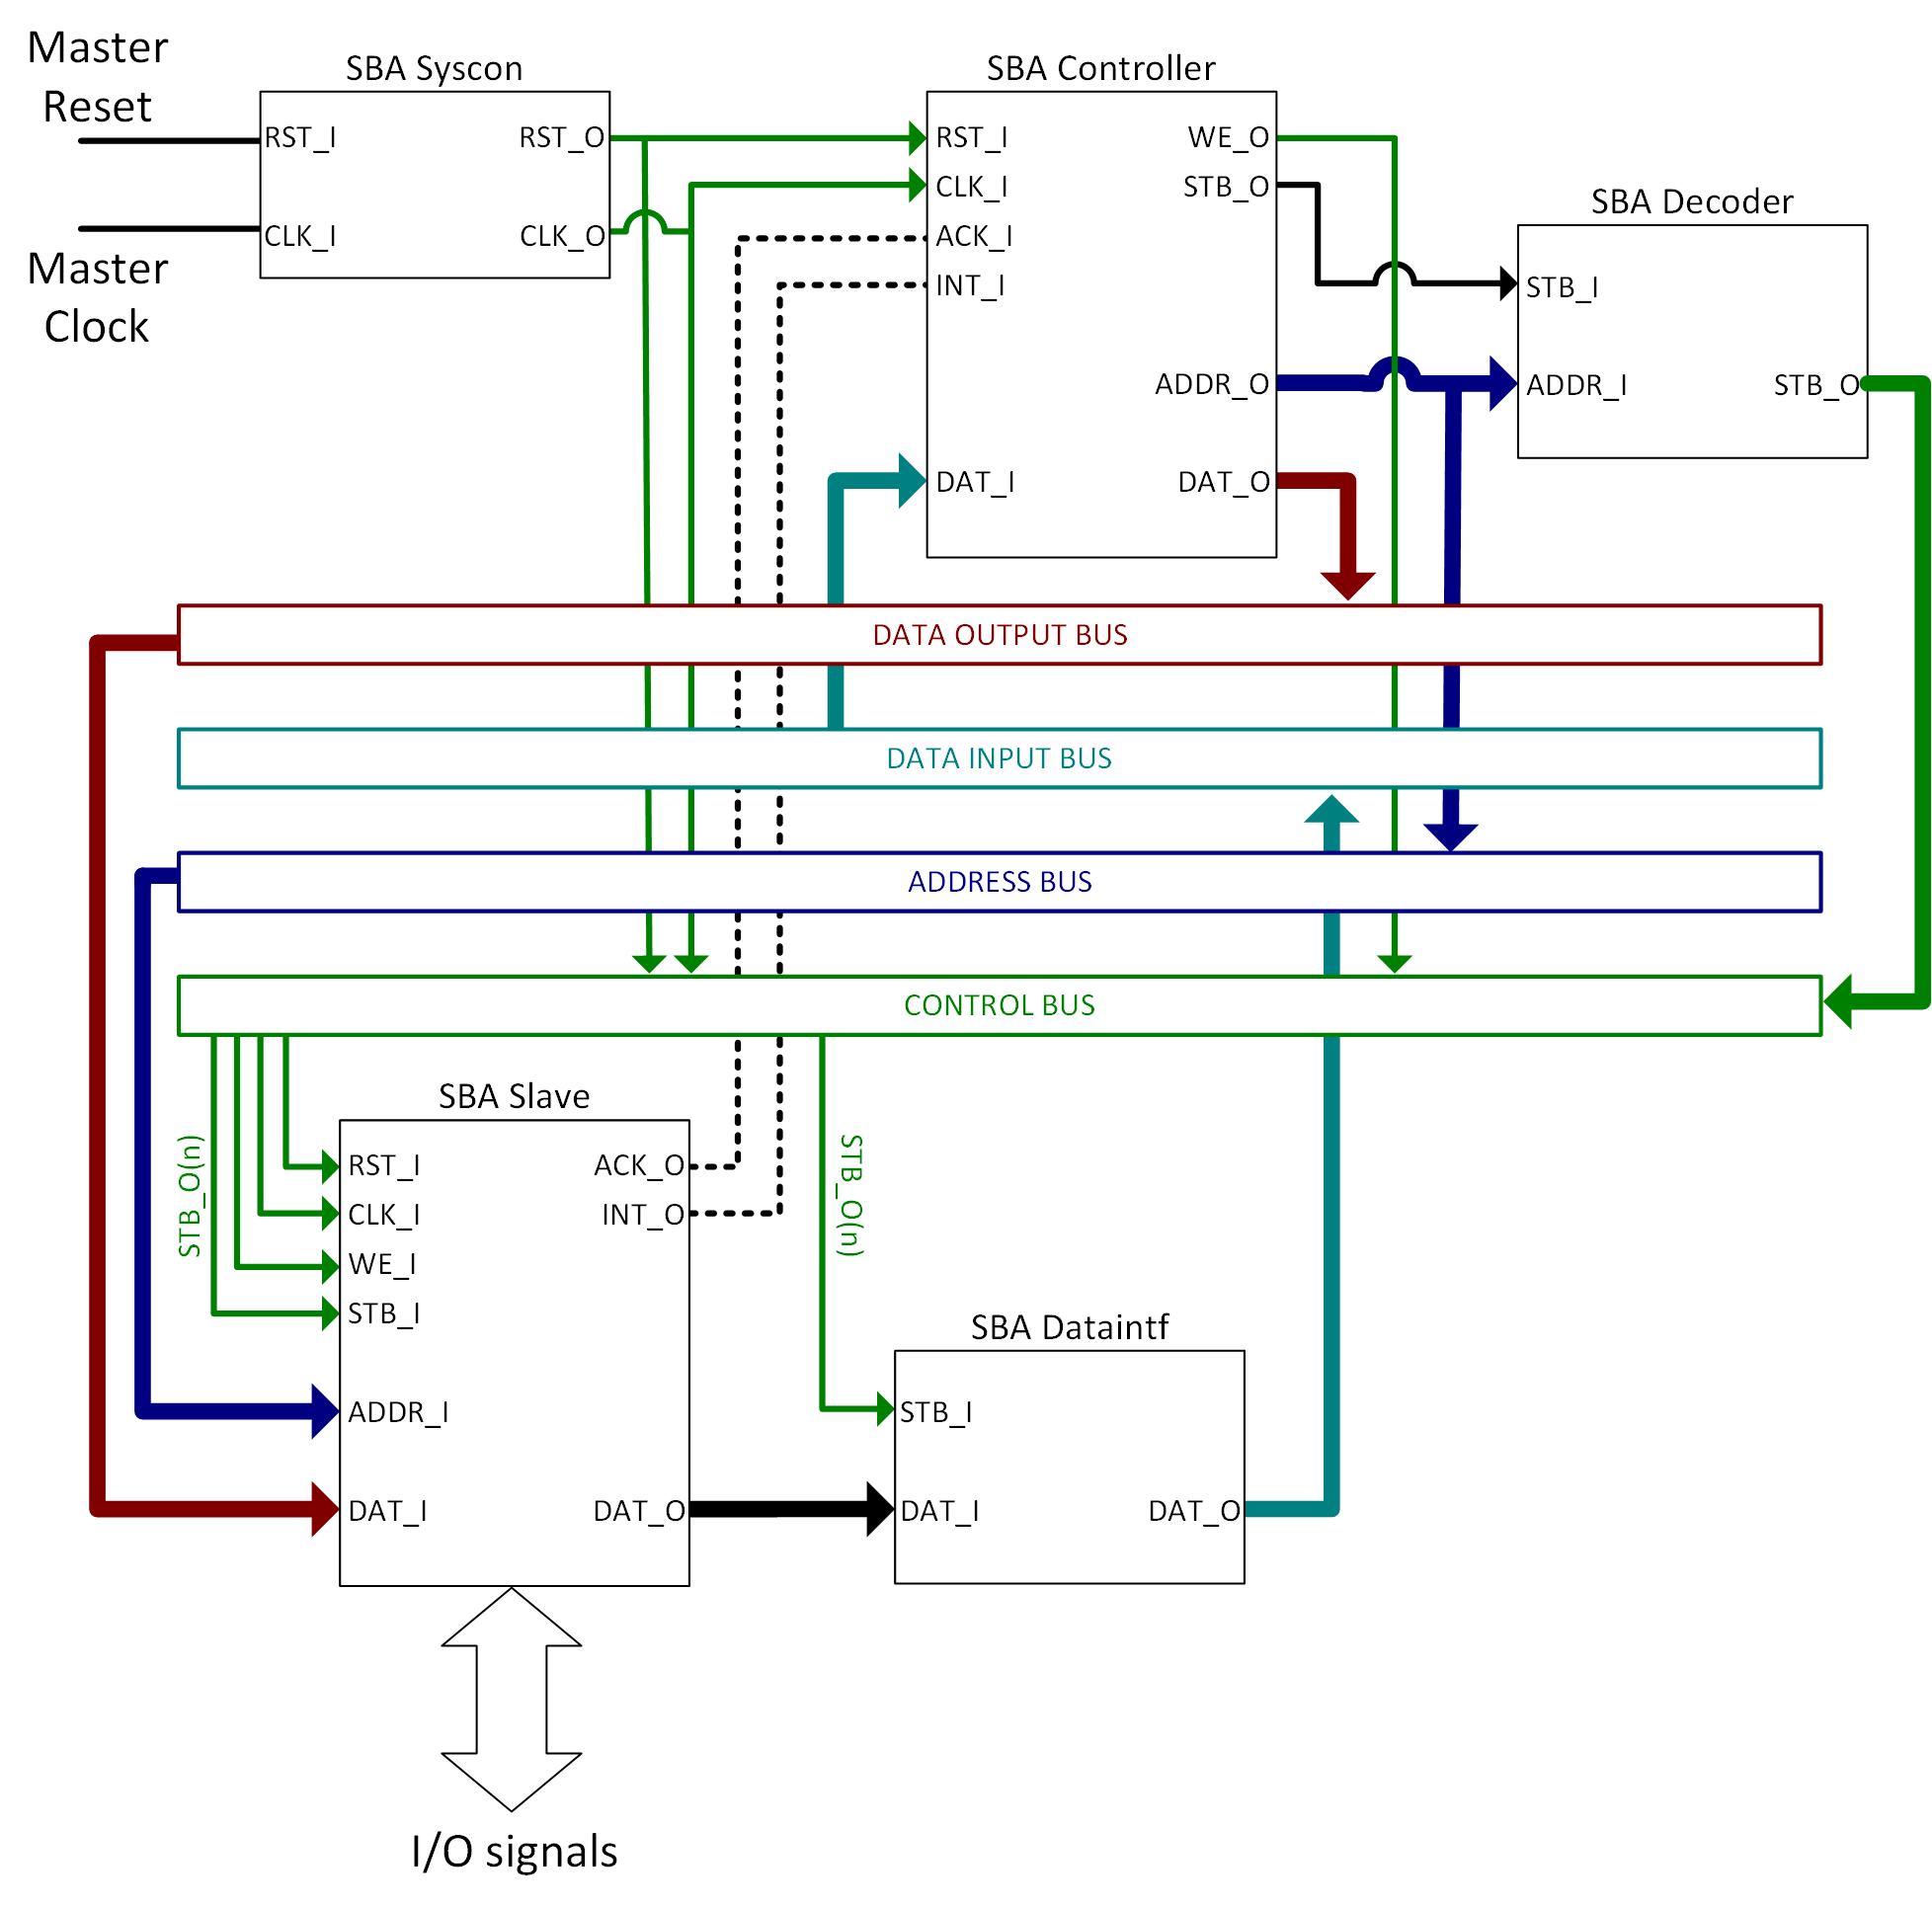
One of the main goals of this project is to build all the code (HDL and PC Software) in a modular way. The Simple Bus Architecture (SBA) allows us to use predefined intellectual property cores (IP Cores) in VHDL and interconnect them, also enabled us to reuse the code in all designs.
The instruments, Oscilloscope, I-V Curve Tracer, Data logger and Arbitrary wave generator, described in this project can communicate with a PC or the HPS directly, using a high-speed serial interface, wireless using Bluetooth and some of the instruments support access to Ethernet network using an instrumentation server, that allows remote communication of the instruments through the local area network or Internet, with multiple remote software clients.
The PC/HPS software has been developed using Lazarus, a cross-platform (Windows, Linux, OSX, etc.) integrated development environment (IDE) for rapid application development (RAD) based in Free Pascal.
The main characteristics (specifications) of the instruments mainly depend on the analog frontend, for example, the limits in the sample rate of the ADC define the maximum bandwidth of the oscilloscope.
Wave Generator Block Diagram
Curve Tracer Block Diagram
Oscilloscope Block Diagram
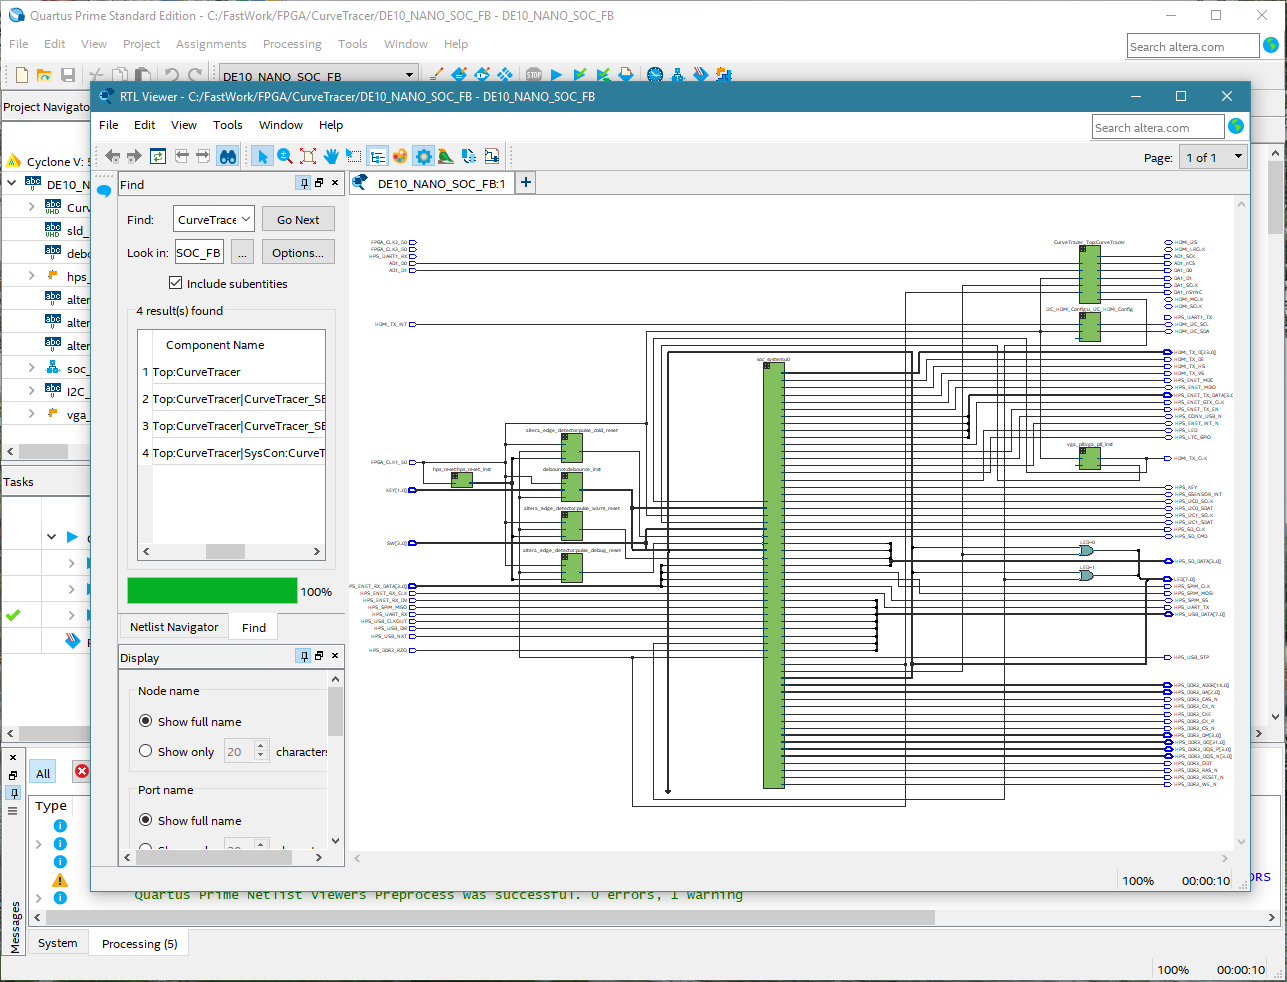
The instrumentation hardware IP cores can be implemented on the DE10-Nano board (Fig. 9), some of the instruments GUI will be ported to the HPS. The bridge server, the piece of software, that converts the equipment in an instrumentation server and allows the remote connection through the network will be also implemented in the HPS.
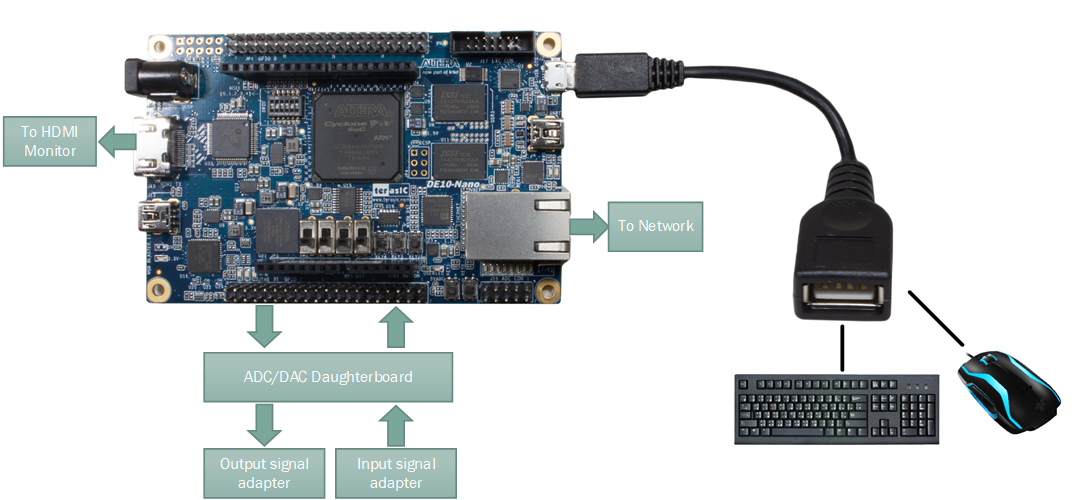
Fig. 9 - Basic block of the virtual instruments implemented in the DE10-Nano board.
The use of the DE10-Nano board and the HPS-FPGA suppose greats advantages:
Boost Performance
Adapt to Changes
Expand I/O
The development of experimental sciences and engineering benefits from the ability to obtain reliable data from controlled situations and process as measurements and comparisons. The tools that allow us to obtain this information are the instruments.
An equipment that allows a measurement or acquisition of information for a specific experiment or work is a permanent requirement in research laboratories, conventional low-cost tools do not always allow adequate customization, and only the most expensive equipment allow programming, configuration or customization. Therefore often, the researchers of low resource centers do not have adequate tools and are in need of making themselves small application specific electronic systems. Most of the time, the hardware and software development for such kinds of devices are not shared and also not reusable.
The development of a custom instrument is a resource and time-consuming task, not only in the design and construction of those but in the development of firmware and support software, which is, often, a task of greater complexity distracting the researcher from real objectives. Virtual instruments are a good alternative because are cheaper than conventional instruments and also more flexible.
The concept of virtual instrumentation is not new, the increase of availability and computational power of the personal computer (PC) and also the cost decrease of them, allow to move some aspects of the conventional instrument to the software on a PC. The interactivity and more complex data calculus of the instruments were migrated to the computer. That made possible, for low requirements, the use of generic or more basic hardware, and therefore cheaper.
With the exponential increment of the complexity of the reconfigurable logic devices, the Field Programmable Gate Array (FPGA) becomes an attractive element for build reconfigurable virtual instruments, because of the inherent flexibility.
The new development of FPGA devices provides mainstream high-performance processor hardware core embedded inside of the chip based on ARM cores, next to the fact of the more capable boards filled with interfaces and memory, allows installing an operating system as Linux and a desktop environment as LXDE.
These new FPGA boards act as a basic computer system with reconfigurable hardware, an ideal platform for virtual instrumentation.
For the development of the instruments described in this work, three main tools were used:
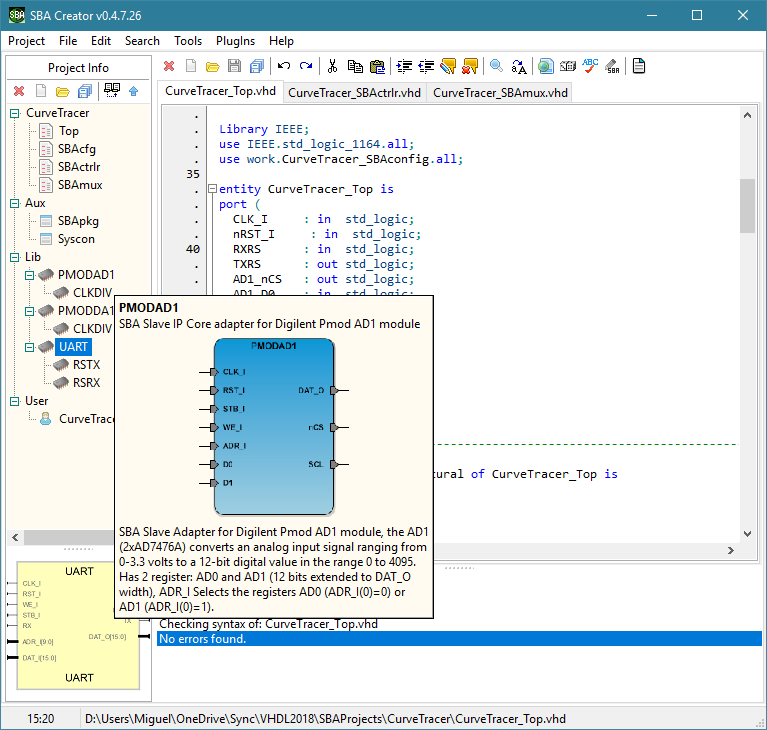
Is a utility program that allows the easy creation of SBA system architecture and the access to a repository with open IP Cores. The SBAcreator, integrate an HDL editor and some tools to basic and easy verification of HDL code. this tool takes care of the interconnection between the modules that are part of the SBA system. The SBA architecture was developed with the intention of aid the interchange and reuse of IP cores and HDL code.
Is a free integrated development environment for the rapid creation of cross-platform applications (RAD). It has a variety of components ready for use and a graphical form designer to easily create complex graphical user interfaces.
A complete software for the development, synthesis, analysis, and implementation of designs into the FPGA.
This project allows implementing several virtual electronic instruments, using libraries an tools available in a free repository.
Some of the instruments are:
This virtual instrument is intended to simulate the behavior of a basic traditional oscilloscope. Fig. 1 shows the basic block diagram of the oscilloscope. The main controller and the data acquisition are in the hardware, the graphical interface (Fig. 2) has been developed to emulate the control panel and the signals screen.
Fig.1 - Oscilloscope block diagram
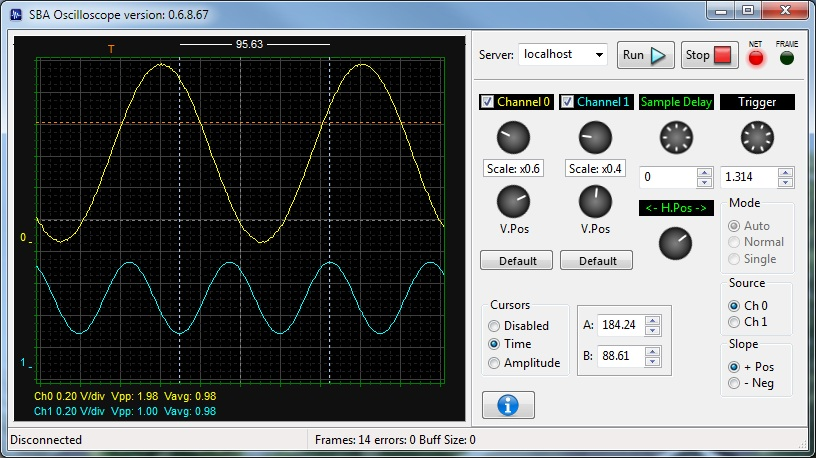
Fig.2 - Oscilloscope GUI
The data acquisition module generates the corresponding signals for controlling the analog to digital converter (ADC), the data is stored in the FPGA board memory and, then packaged to be sent to the PC in frames.
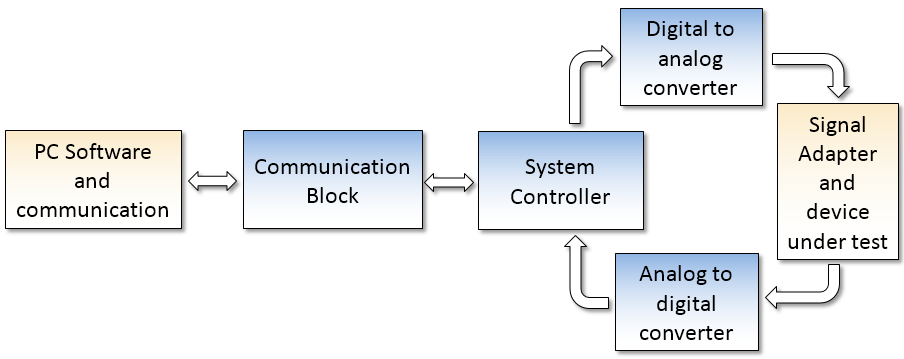
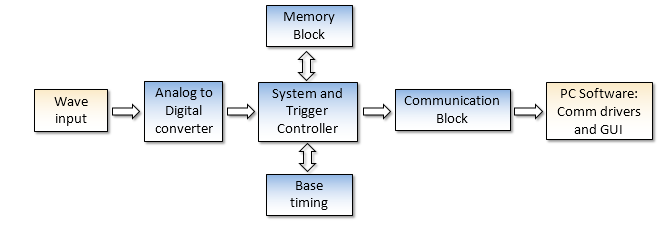
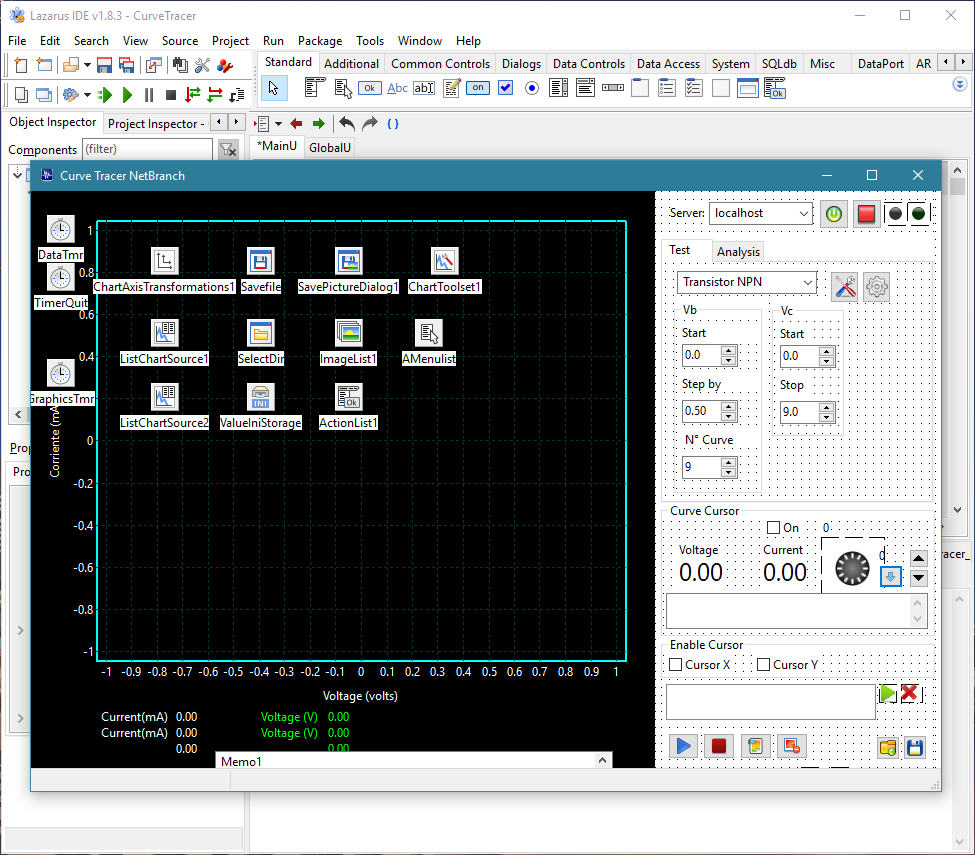
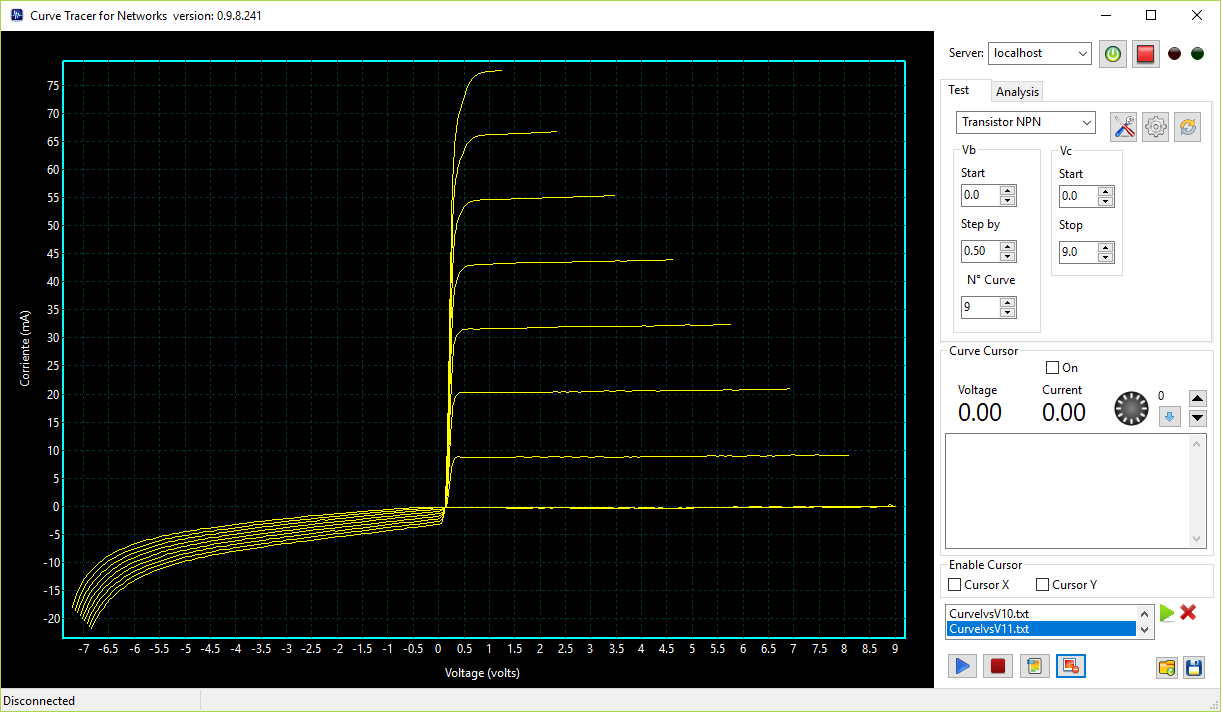
This instrument enables to plot the current vs voltage characteristic curve and extracts some of the quantitative parameters of devices like Bipolar Transistors, Field-Effect Transistor (JFET), MOSFET Transistors, Diodes, etc. Fig. 3 shows the block diagram of this virtual instrument. The FPGA implements a system that can generate various voltage levels, where these levels are provided by the PC software. They are used to stimulate the object under study. The current values are recorded and then sent to the PC graphic user interface (GUI) (Fig. 4).
Fig. 3 - Block diagram of I-V curve tracer.
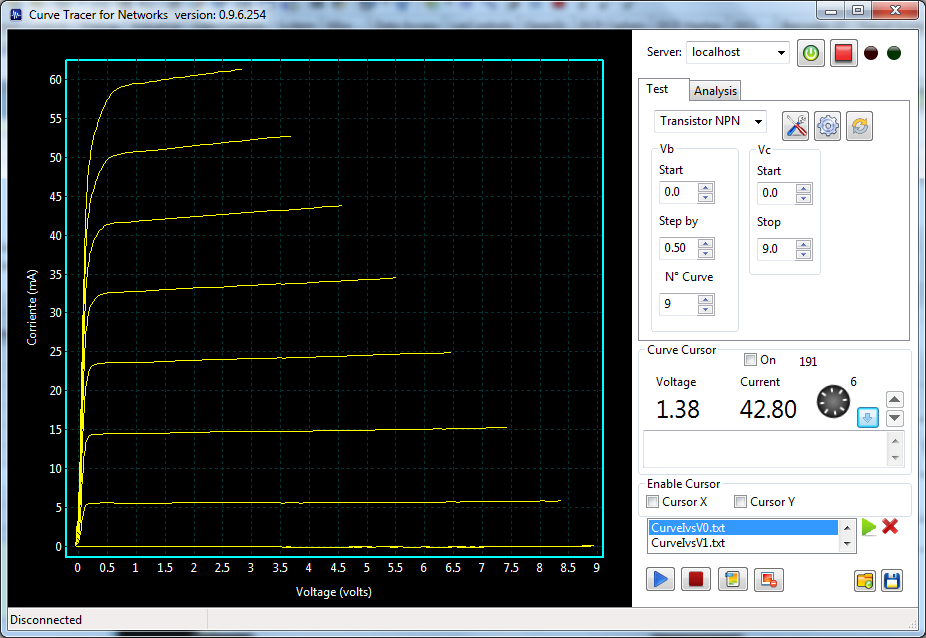
Fig. 4 - Screenshot GUI of curve tracer with an NPN I vs V curves.
The values generated by the digital to analog converter (DAC), have limitations on current and voltage, these cannot be connected directly and it is necessary an intermediate stage (output signal adapter) in order to generate higher voltages and currents to make the device characterization.
The Data Logger is an instrument that allows the records and storage of data over time, the sample rate is configurable and slower than the digital oscilloscope, but can storage a large quantity of data in a database file. Fig. 5 show the basic GUI of the Data Logger.
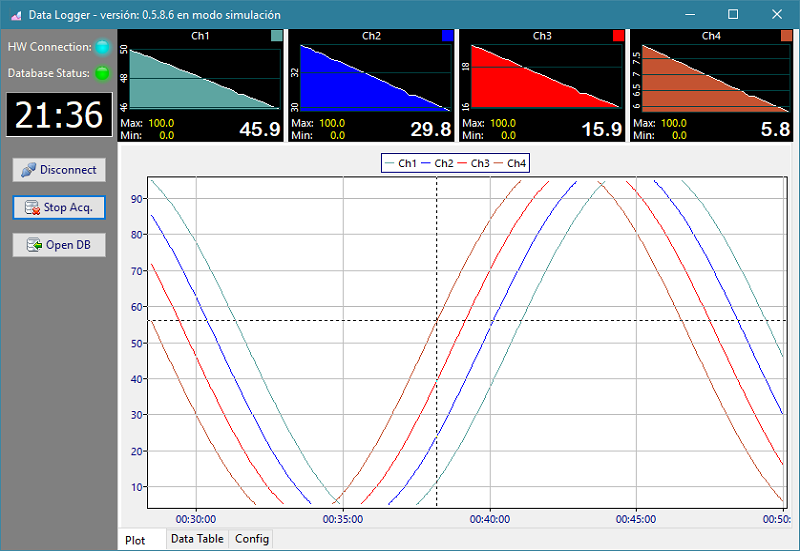
Fig. 5 - Data Logger GUI
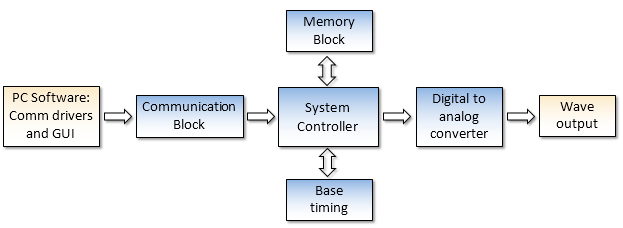
Also known as a function or signal generator, is a versatile instrument that allows generating a signal whose potential varies with time in a controlled and programmable way, that is to say, waves with frequency and configurable shapes. Fig. 6 shows the GUI designed for the waveform generator, which is able to create data values for simple functions, such as sawtooth, square, triangular, sinusoidal and arithmetic operations; and complex arbitrary signals, the interface is able to control the amplitude, vertical offset, and frequency of the signal.
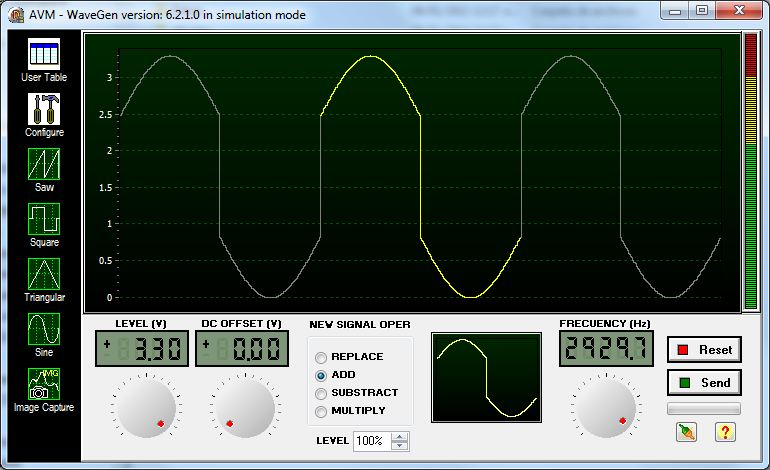
Fig. 6 - User Interface arbitrary wave generator.
Fig. 7 and 8 shows an application that generates signals using images, a photograph of an oscilloscope’s display which is showing a signal of action potential of a real neuron, is processed automatically to extract data of amplitude values that will be used to fill the data table of waveform generator; after, the virtual instrument is able to reproduce the signal and also combine or make mathematical operations for test purposes.
The software supports other waveforms by programming plugins, so you can add new features to the program independently. Following a protocol, the system automatically recognizes the new feature set and places the button in the main interface.
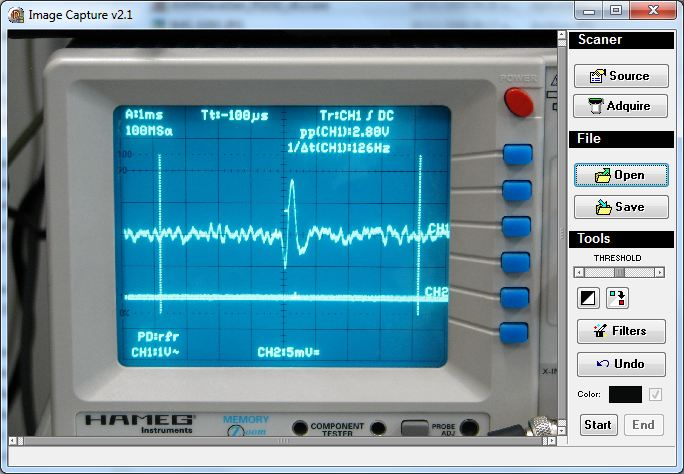
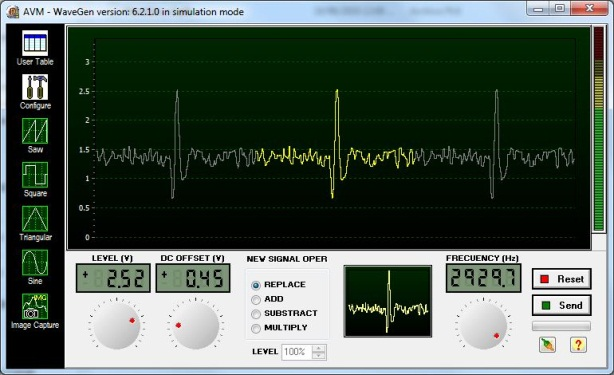
Fig. 7 and 8 - Generating a simulation of a neuronal action potential impulse from a real image of an oscilloscope.
Because the sources (HDL and High level) will be available; the researchers, students, hobbyists, etc. can assemble their own instruments. Fig. 9 shows a custom instrument, made with wave generator and oscilloscope basic blocks. The user can generate a wave as an input for an external filter and then the signal coming from the filter, as input to the basic oscilloscope to review the results. Both (basic wave generator and oscilloscope are working at the same time).
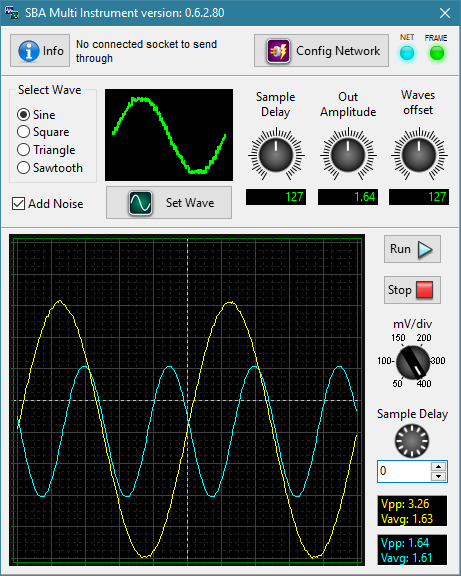
Fig. 9 - Example of custom Instrument to test the effectiveness of filters.
To implement these instruments on the DE10-Nano, we first have to set up the toolchain to compile the GUI of the instruments in Lazarus and prepare the cross compilers. That allows us to get the GUI's ready for transfer to the uSD card of the DE10-Nano. The Fig. 10 and 11 show the Instruments GUI's running on two different Linux distributions.
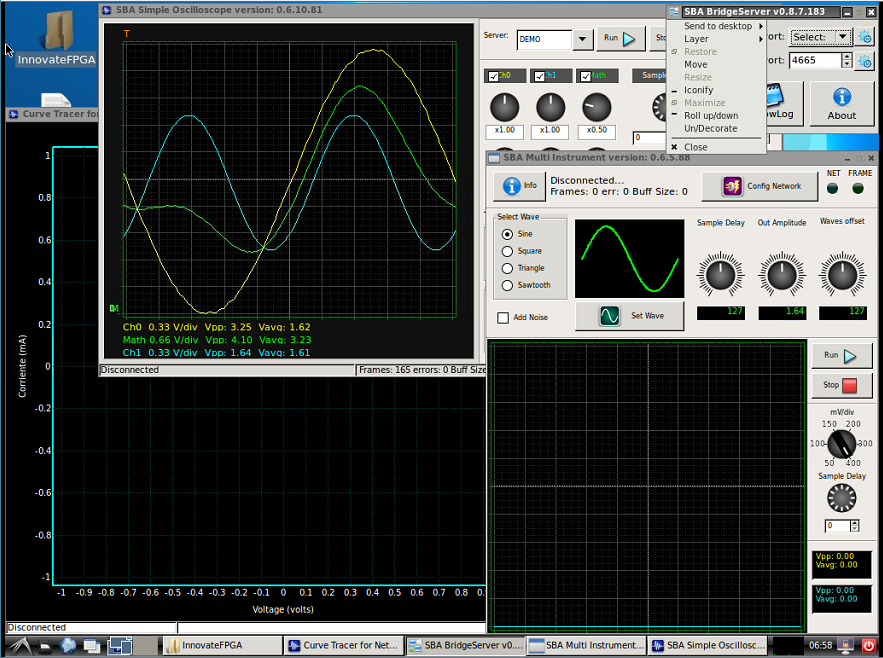
Fig.10 - Instruments and the Instrumentation Server running in the Ubuntu 16.04.1 LTS and Lxde desktop of the DE10-Nano
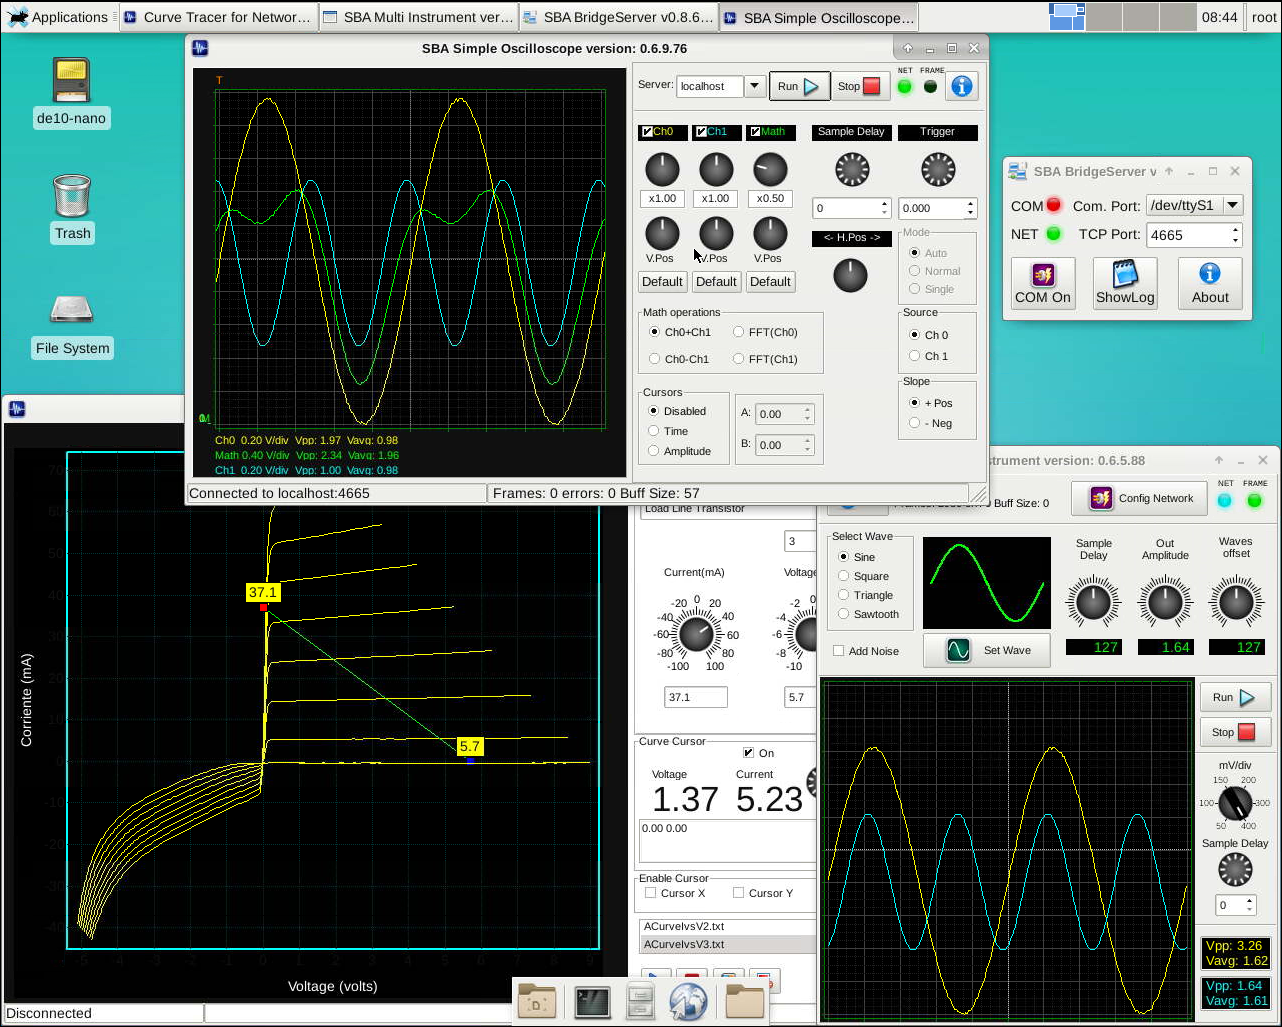
Fig. 11 - Instruments and the Instrumentation Server running in the Angstrom GNU/Linux of the DE10-Nano
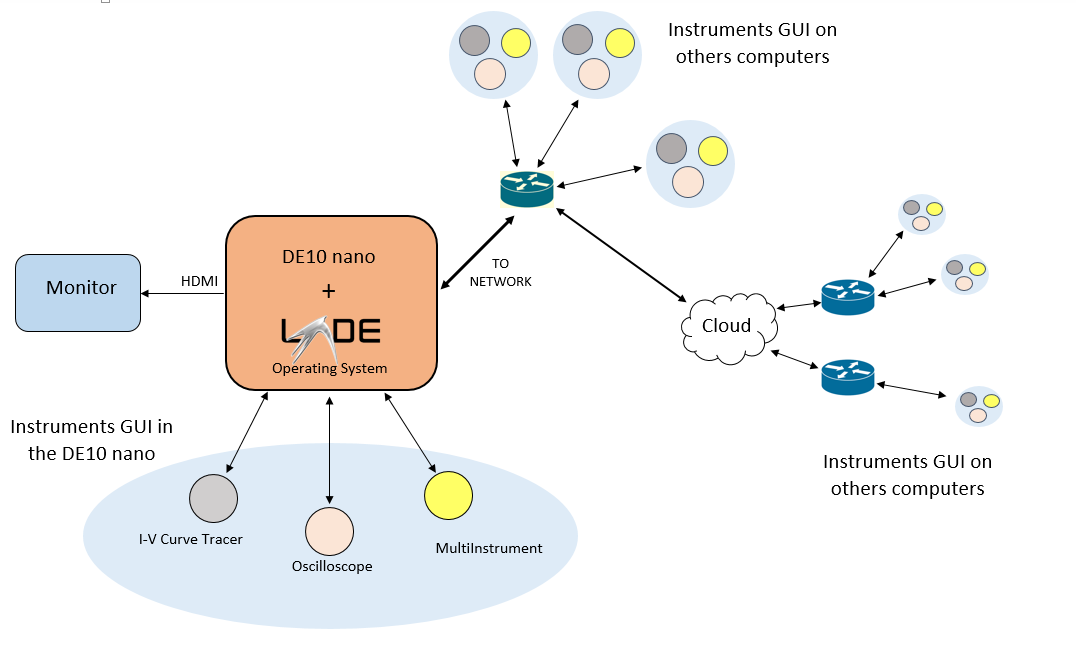
The GUI's communicate with the Instruments implemented on the FPGA through a bridge server (Instrumentation server is the device that runs the bridge server, in this case, the DE10-Nano itself). The bridge server, see fig. 12, gets the data from two different domains, it communicates with the FPGA hardware using a common and compatible interface as a high-speed serial port and communicates with the software through a network interface. A simplified diagram of the connectivity is in the Fig. 13.
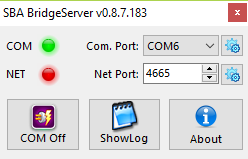
Fig. 12 - Bridge Server
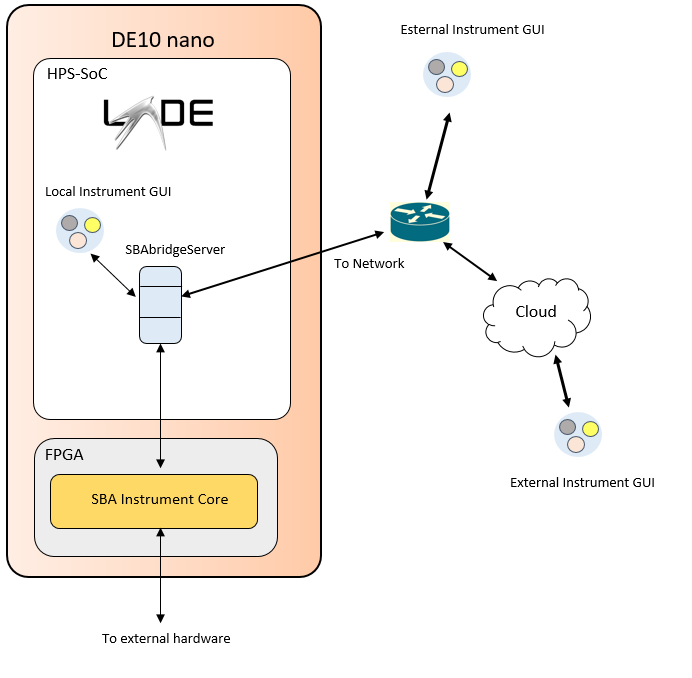
Fig. 13 - Simplified diagram of the instruments connectivity
Because the instrument data is available to the network, any device attached to the local network can use it and run the instruments GUI. If an adequate port is forwarded by the router, the hardware instrument could be available to the Internet.
The final design must be capable of running the totality of a virtual instrument design, that includes:
Previous works had separate hardware for each part of the virtual instrument, for example, the instrumentation core was implemented in an FPGA board. That board had a communication link with a PC where the GUI's were installed. The picture below shows that implementation:
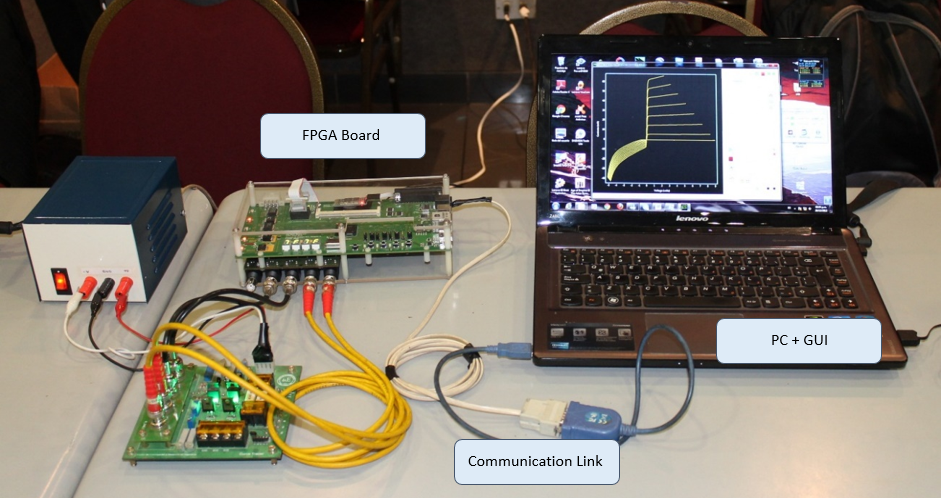
Now we have a very compact setup where is not necessary a computer. The DE10-Nano implement the Instrument core, the GUI interface, and the Instrumentation Server.
MultiInstrument:
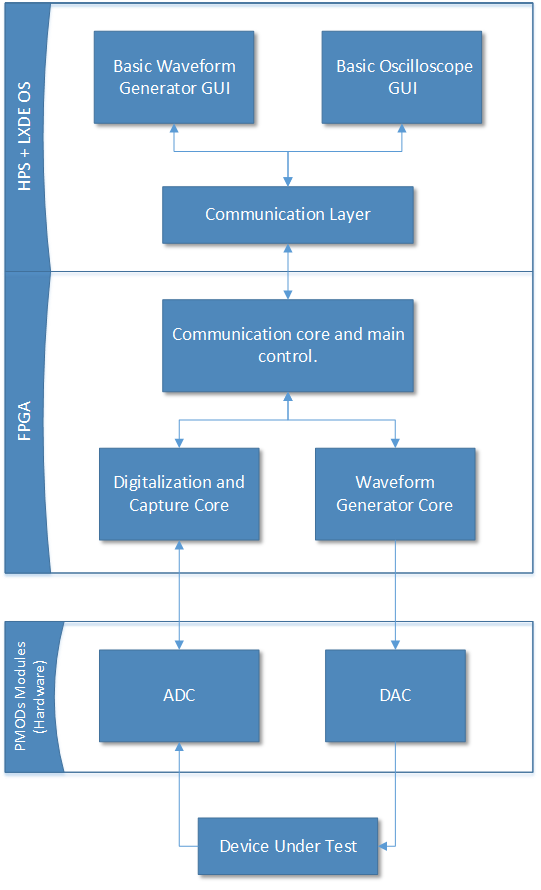
Fig. Block diagram of the architecture of the MultiInstrument.
I-V Curve Tracer:
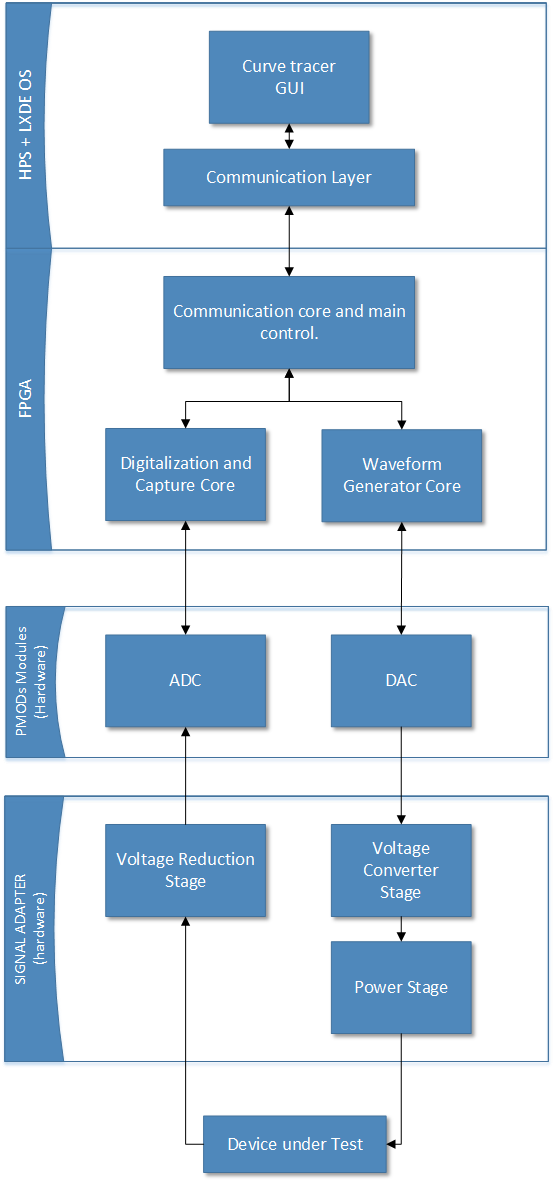
Fig. Block diagram of the architecture of the I-V Curve Tracer Instrument.
The curve tracer must generate different stimulus in order to obtain the I-V characteristics of the device under test (DUT).
For example, to obtain an I versus V curve for a bipolar transistor, a signal in the form of a sawtooth is generated under control of the software on the PC/HPS. Then the data obtained is processed and graphed.
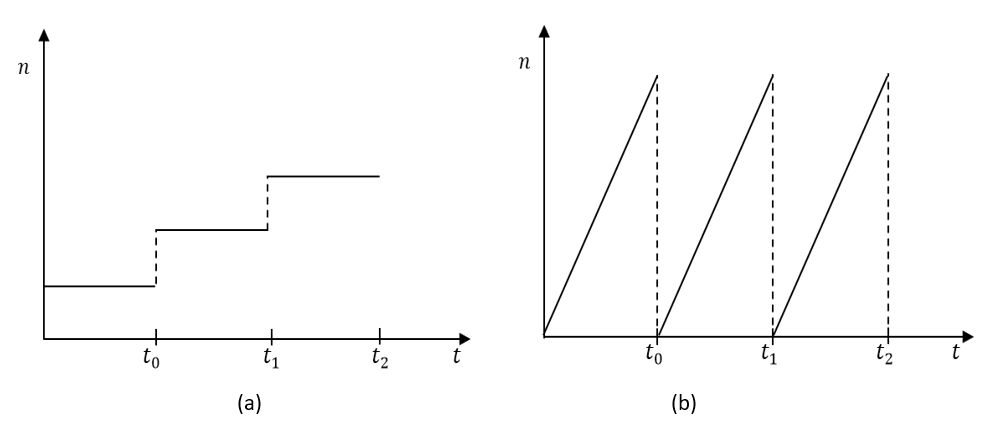
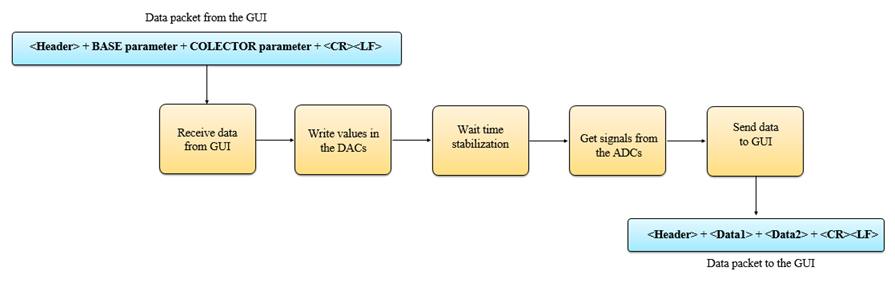
The following figure shows the block diagram of the operation of the control system implemented in the FPGA of the instrument.
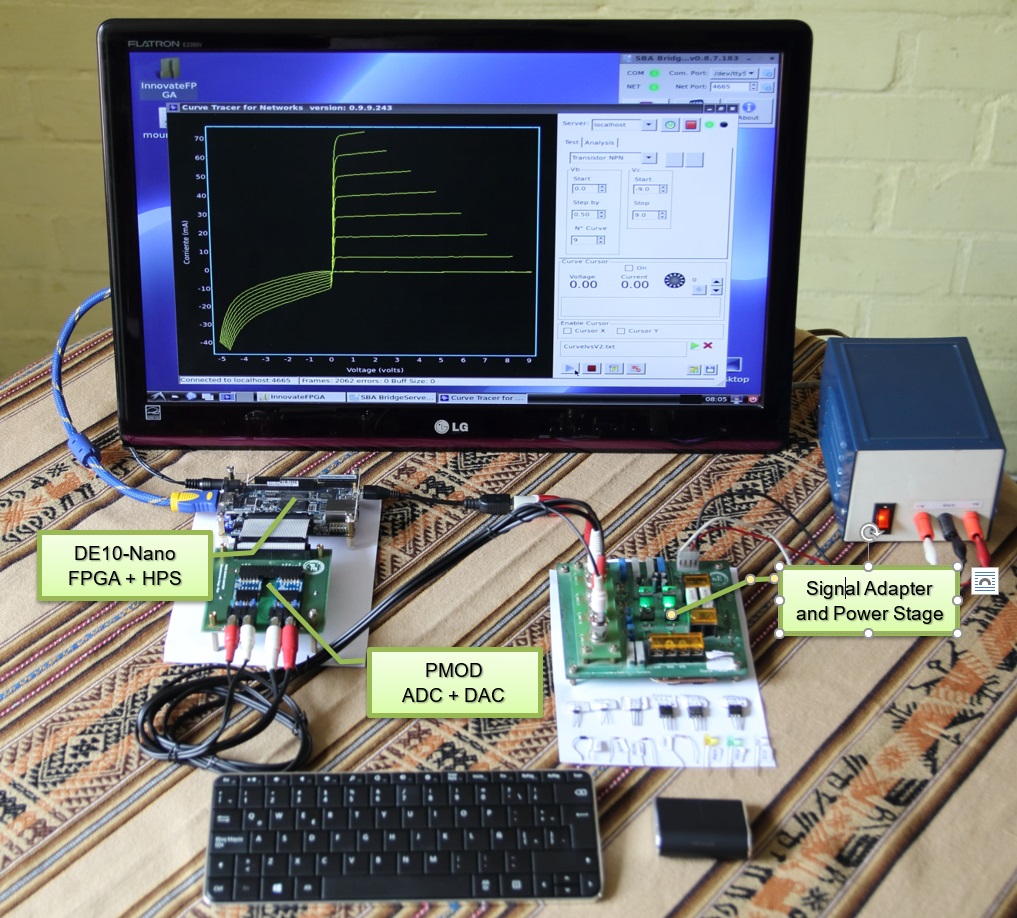
A PCB board was designed and built to connect the PMOD modules to the DE10-Nano.
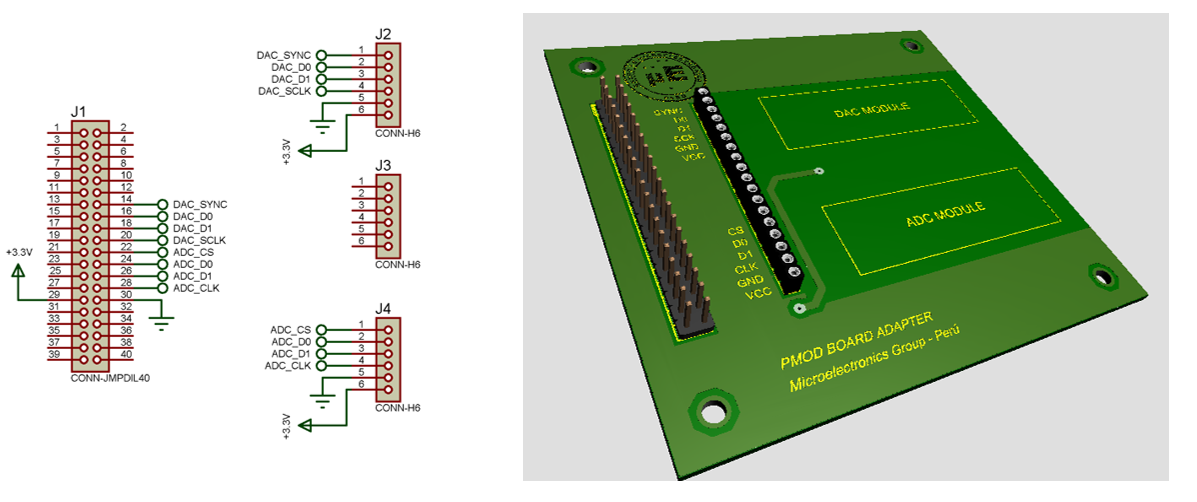
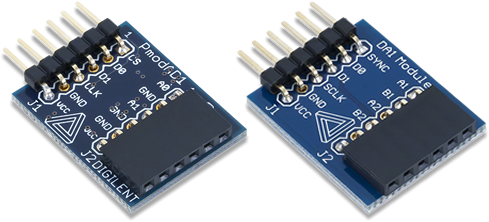
PMODs Modules
The values generated by the Digital to Analog Converter (DAC) have limitations in current and voltage, these cannot be directly connected to the DUT and an intermediate stage (Signals Adapter) is needed to generate the adequates voltages and currents, large enough for the characterization.
The following figure shows the schematics of the signals adapter that allowed to achieving the requirements of the prototype.
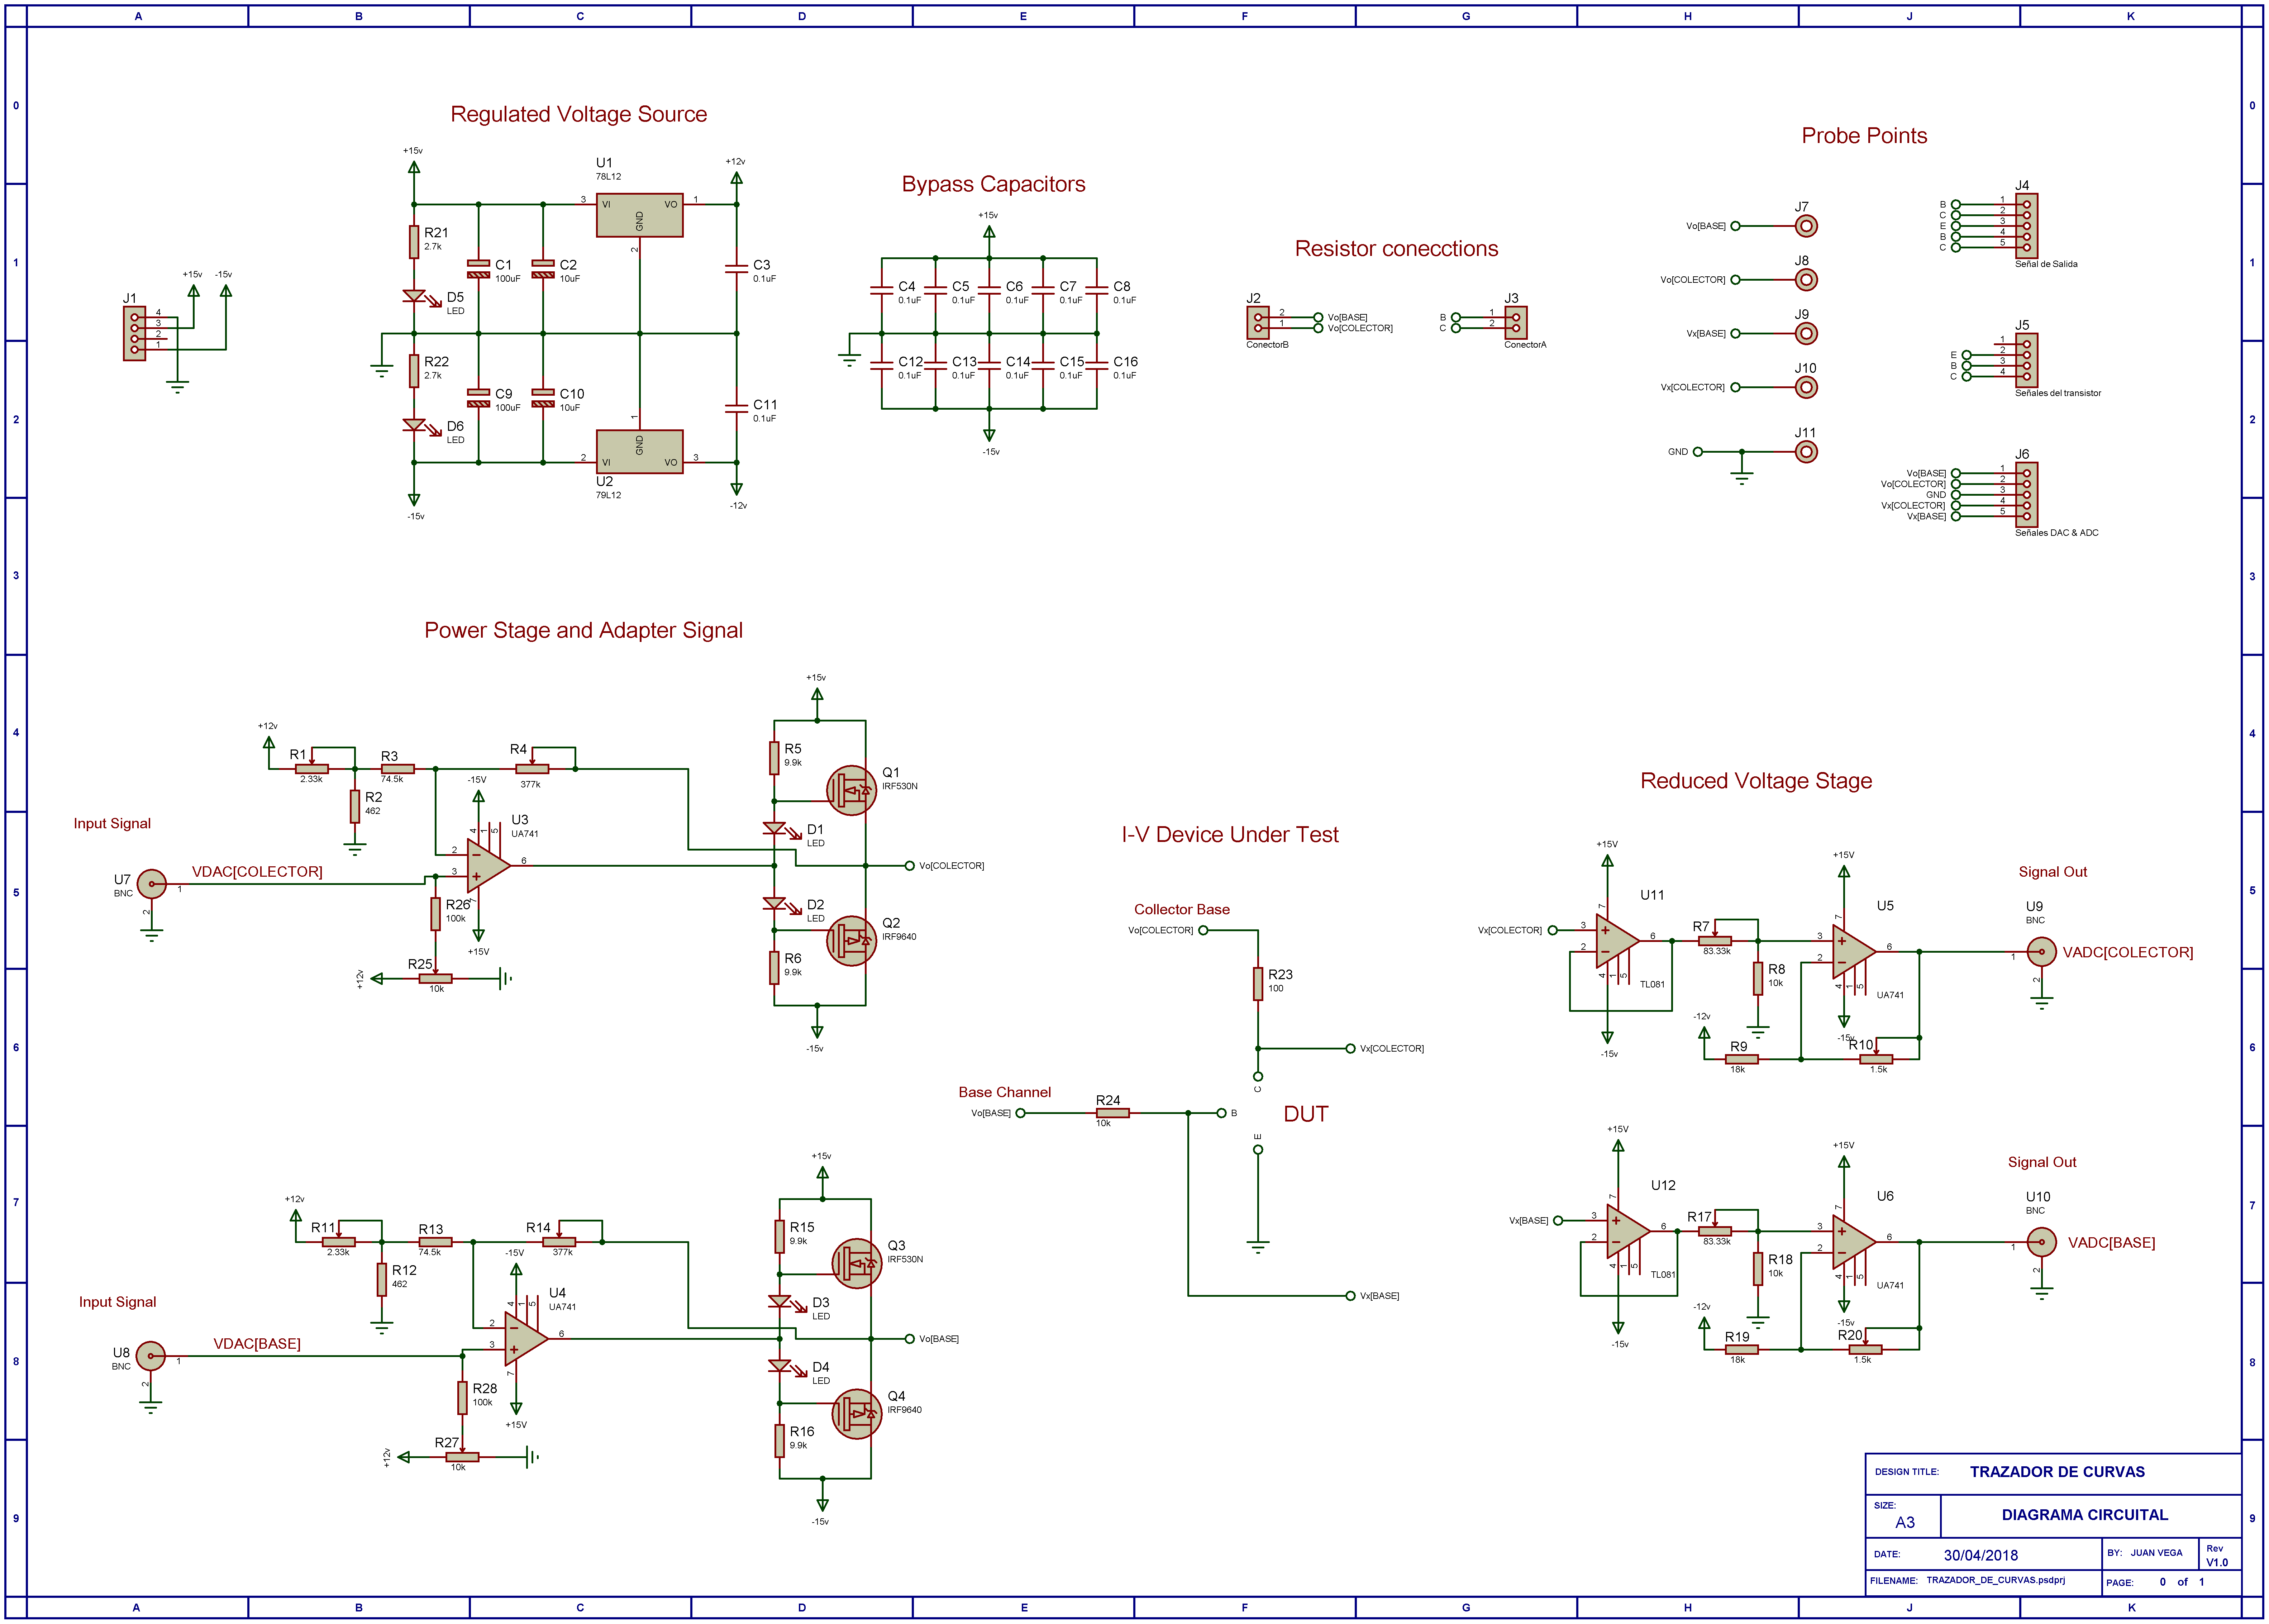
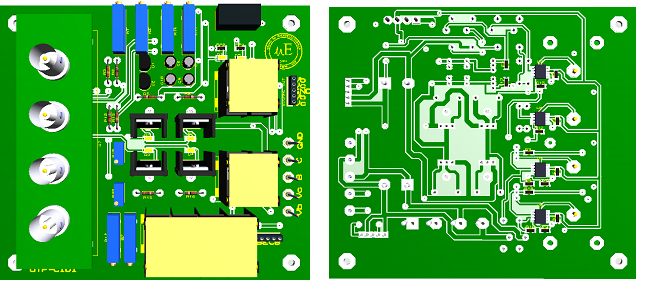 3D visualization of the Power Stage and Signals Adapter for the I-V curve tracer
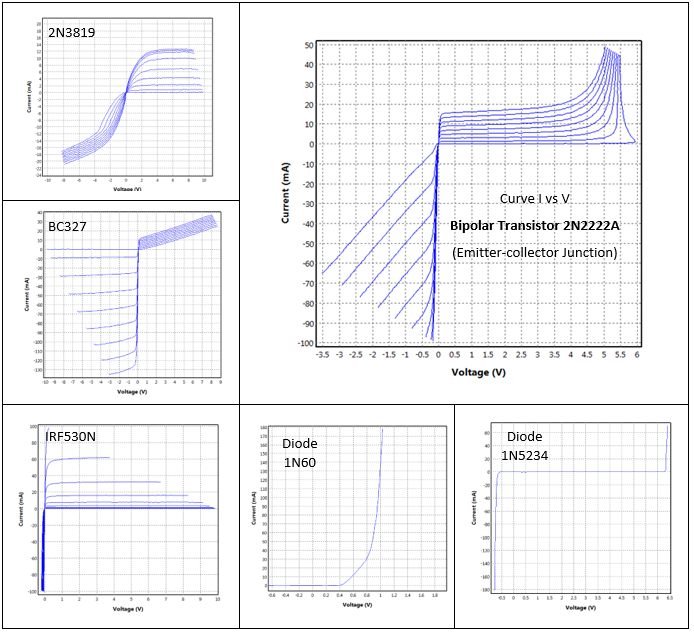
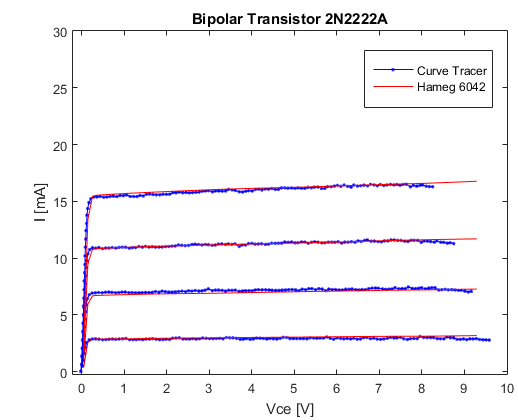
Example of I-V Curve for the Transistor 2N2222
8. Instruments parameters and resource use summary.
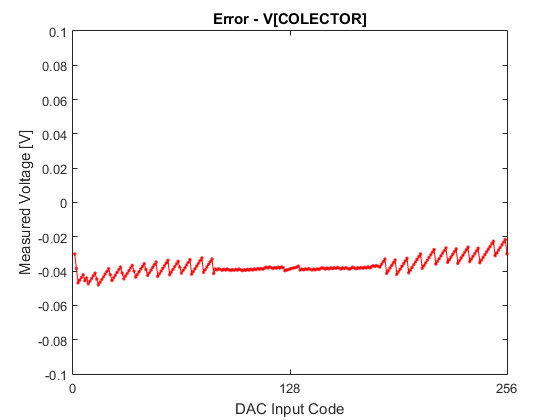
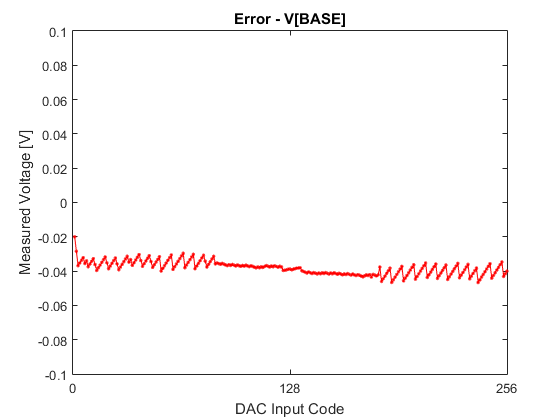
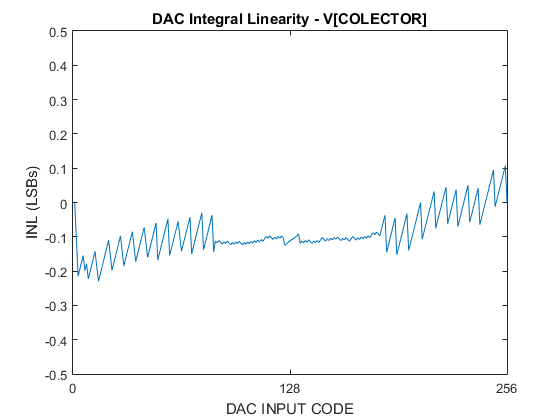
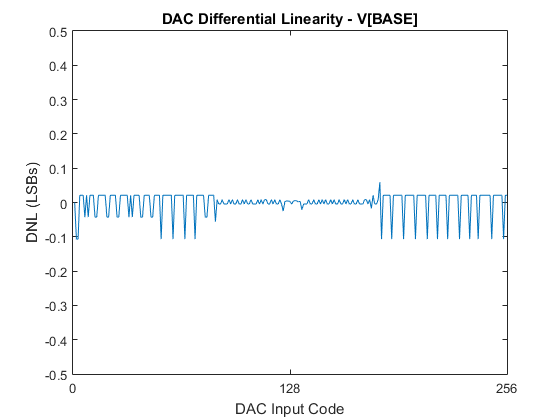
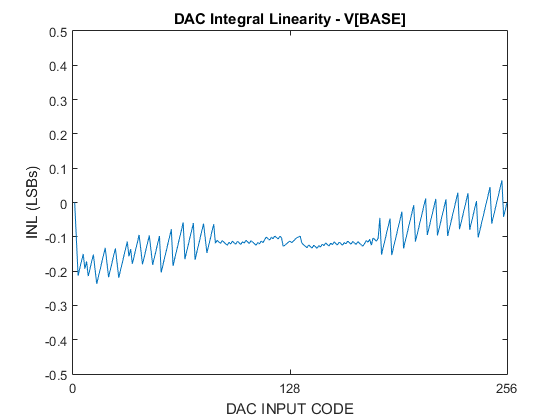
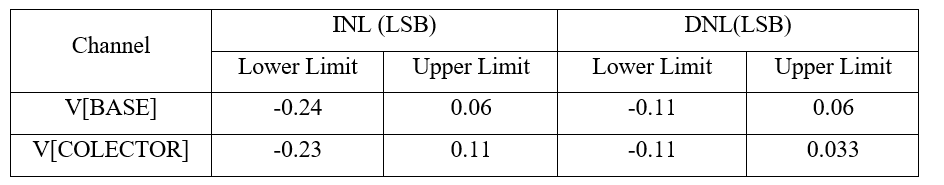
The IV Curve tracer was developed in more detail. It has a uniqueness of algorithm, HDL and software code to implement low resources and fast filters. We take data from several electronic components and we compare the results with reference instruments. Here are some of the data collected while the instrument was validated using a Sanwa CD771 multimeter. Some of the results and graphics are extensible to the others instruments that using the same analog frontend.
![]()
![]()
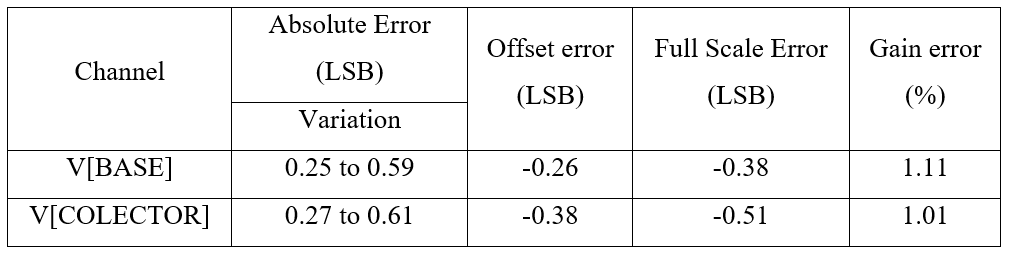
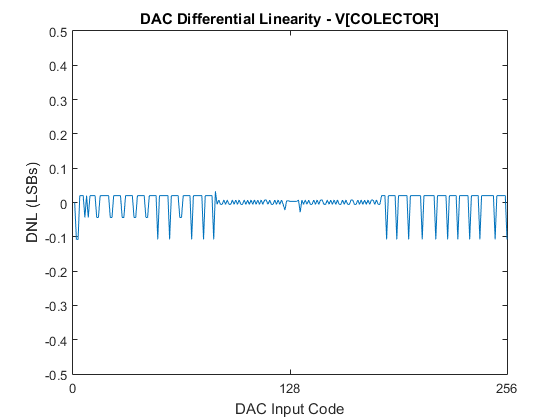
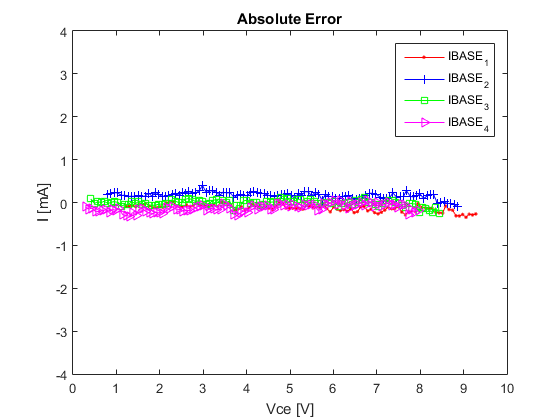
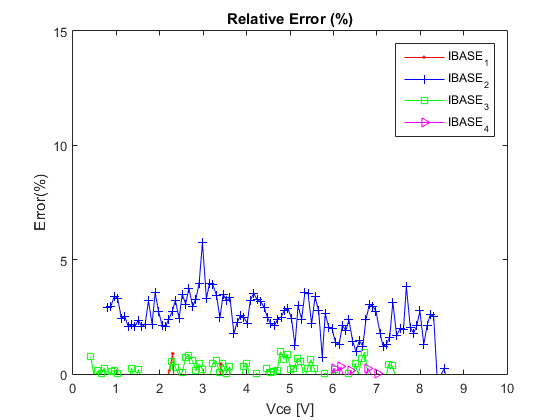
Graphics and tables about of absolute and relative errors (DAC + Signal Adapter):
For the validation of the IV Curve tracer, was used the Hameg HM6042, because this is a hybrid (analog/digital) instrument, the measurements were taken manually using the cursors.
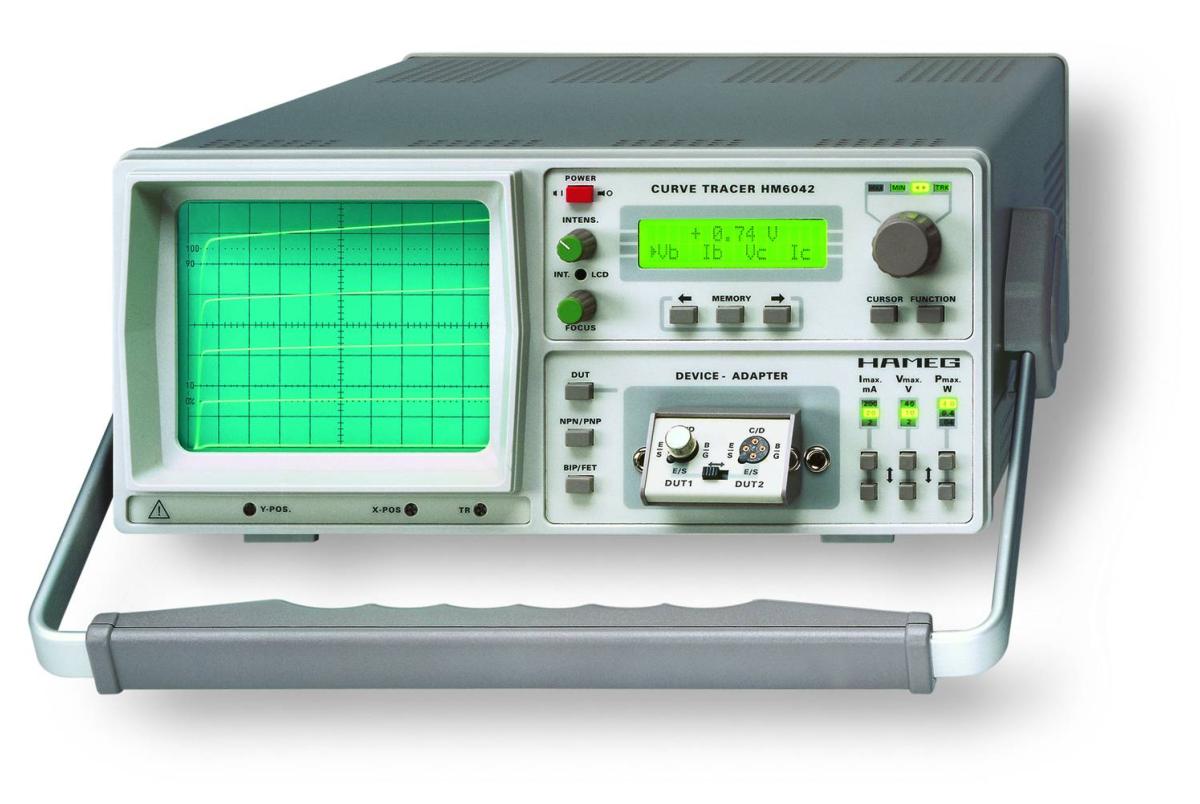
Below is a graphic comparing the output of the Hameg 6042 with the IV Curve Tracer.
The multi-instrument, the wave generator and the oscilloscope, all share the same FPGA design, then have the same resources utilization. The below table, list the fitter summary:
| Logic utilization (in ALMs) | 5,985 / 41,910 ( 14 % ) |
|---|---|
| Total registers | 8777 |
| Total pins | 180 / 314 ( 57 % ) |
| Total block memory bits | 72,590 / 5,662,720 ( 1 % ) |
| Total RAM Blocks | 20 / 553 ( 4 % ) |
| Total DSP Blocks | 2 / 112 ( 2 % ) |
| Total PLLs | 1 / 6 ( 17 % ) |
| Total DLLs | 1 / 4 ( 25 % ) |
For the curve tracer the table with the fitter summary is:
| Logic utilization (in ALMs) | 5,183 / 41,910 ( 12 % ) |
|---|---|
| Total registers | 8288 |
| Total pins | 182 / 314 ( 58 % ) |
| Total block memory bits | 62,366 / 5,662,720 ( 1 % ) |
| Total RAM Blocks | 18 / 553 ( 3 % ) |
| Total DSP Blocks | 0 / 112 ( 0 % ) |
| Total PLLs | 1 / 6 ( 17 % ) |
| Total DLLs | 1 / 4 ( 25 % ) |
All instruments share the same HPS configuration:
| Hard processor system peripheral utilization | |
|---|---|
| -- Boot from FPGA | 1 / 1 ( 100 % ) |
| -- Clock resets | 1 / 1 ( 100 % ) |
| -- Cross trigger | 0 / 1 ( 0 % ) |
| -- S2F AXI | 1 / 1 ( 100 % ) |
| -- F2S AXI | 1 / 1 ( 100 % ) |
| -- AXI Lightweight | 1 / 1 ( 100 % ) |
| -- SDRAM | 1 / 1 ( 100 % ) |
| -- Interrupts | 1 / 1 ( 100 % ) |
| -- JTAG | 0 / 1 ( 0 % ) |
| -- Loan I/O | 0 / 1 ( 0 % ) |
| -- MPU event standby | 0 / 1 ( 0 % ) |
| -- MPU general purpose | 0 / 1 ( 0 % ) |
| -- STM event | 1 / 1 ( 100 % ) |
| -- TPIU trace | 1 / 1 ( 100 % ) |
| -- DMA | 0 / 1 ( 0 % ) |
| -- CAN | 0 / 2 ( 0 % ) |
| -- EMAC | 1 / 2 ( 50 % ) |
| -- I2C | 2 / 4 ( 50 % ) |
| -- NAND Flash | 0 / 1 ( 0 % ) |
| -- QSPI | 0 / 1 ( 0 % ) |
| -- SDMMC | 1 / 1 ( 100 % ) |
| -- SPI Master | 1 / 2 ( 50 % ) |
| -- SPI Slave | 0 / 2 ( 0 % ) |
| -- UART | 2 / 2 ( 100 % ) |
| -- USB | 1 / 2 ( 50 % ) |
9. Conclusions
With this project, we want to give to the community the necessary FPGA IP cores and Software libraries to making their own instruments. There are no limits to the improvement of future development. At first, we develop the SBA architecture for our designs but then we found in it an inherent educative value, this project uses this architecture with that purpose. All the source code (HDL + Processor software) has been writing to make it modular and shareable. We design the basic instruments for help as a start point to custom development. We hope to help with the better understanding of the fundamental of electronic instrumentation and nothing is better than build our own instrument.
The HDL IP cores and tools for the building of this kind of instruments can be found on our repositories:
https://github.com/mriscoc/SBA/releases
https://github.com/mriscoc/SBA-Library
And soon we will be going to add the repository with all the demonstrative instruments.
We found to the DE10-Nano one of the best boards for this project because of the balance between FPGA capabilities, CPU, interfaces and the cost. We suggest the building of some cheap daughter boards that can implement the electronics for basic instrumentation. Maybe with the same (ADC/DAC) converters included on the PMOD plus some frontend opams with analog multiplexers and using the Arduino connector or the 2x20 GPIO.